Investor Presentation J u n e 2 0 2 2 Exhibit 99.1
Forward Looking Statement Safe Harbor and Non-GAAP Information Forward-Looking Statements This presentation includes "forward-looking statements" within the meaning of the Private Securities Litigation Reform Act of 1995 and other applicable federal securities laws. All statements that are not historical facts are forward-looking statements. Forward looking statements can be identified through the use of words such as "estimate," "project," "intend," "expect," "believe," "should," "anticipate," "hope," "optimistic," "plan," "outlook," "should," "could," "may" and similar expressions. The forward-looking statements are subject to certain risks and uncertainties, including without limitation those identified below, which could cause actual results to differ materially from historical results or those anticipated. Readers are cautioned not to place undue reliance on these forward- looking statements. The following factors could cause actual results to differ materially from historical results or those anticipated: adverse economic conditions, including risks relating to the impact and spread of and the government’s response to COVID-19; inability to weather an economic downturn; the impact of competitive products and pricing; product demand and acceptance risks; raw material and other increased costs; raw material availability; financial stability of the Company’s customers; customer delays or difficulties in the production of products; loss of consumer or investor confidence; employee relations; ability to maintain workforce by hiring trained employees; labor efficiencies; risks associated with acquisitions; environmental issues; negative or unexpected results from tax law changes; inability to comply with covenants and ratios required by the Company’s debt financing arrangements; and other risks detailed from time-to-time in Synalloy Corporation's Securities and Exchange Commission filings, including our Annual Report on Form 10-K, which filings are available from the SEC. Synalloy Corporation assumes no obligation to update any forward- looking information included in this release. Non-GAAP Financial Information Financial statement information included in this presentation includes non-GAAP (Generally Accepted Accounting Principles) measures and should be read along with the accompanying tables which provide a reconciliation of non-GAAP measures to GAAP measures. Adjusted EBITDA is a non-GAAP financial measure that the Company believes is useful to investors in evaluating its results to determine the value of a company. An item is excluded in the measure if its periodic value is inconsistent and sufficiently material that not identifying the item would render period comparability less meaningful to the reader or if including the item provides a clearer representation of normalized periodic earnings. The Company excludes in Adjusted EBITDA two categories of items: 1) Base EBITDA components, including: interest expense (including change in fair value of interest rate swap), income taxes, depreciation and amortization, and 2) Material transaction costs including: goodwill impairment, asset impairment, gain on lease modification, stock-based compensation, non-cash lease cost, acquisition costs and other fees, proxy contest costs and recoveries, loss on extinguishment of debt, earn-out adjustments, realized and unrealized (gains) and losses on investments in equity securities and other investments, retention costs, and restructuring & severance costs from net income. Management believes that these non-GAAP measures provide additional useful information to allow readers to compare the financial results between periods. Non-GAAP measures should not be considered as an alternative to any measure of performance or financial condition as promulgated under GAAP, and investors should consider the Company's performance and financial condition as reported under GAAP and all other relevant information when assessing the performance or financial condition of the Company. Non-GAAP measures have limitations as analytical tools, and investors should not consider them in isolation or as a substitute for analysis of the Company's results or financial condition as reported under GAAP. 2
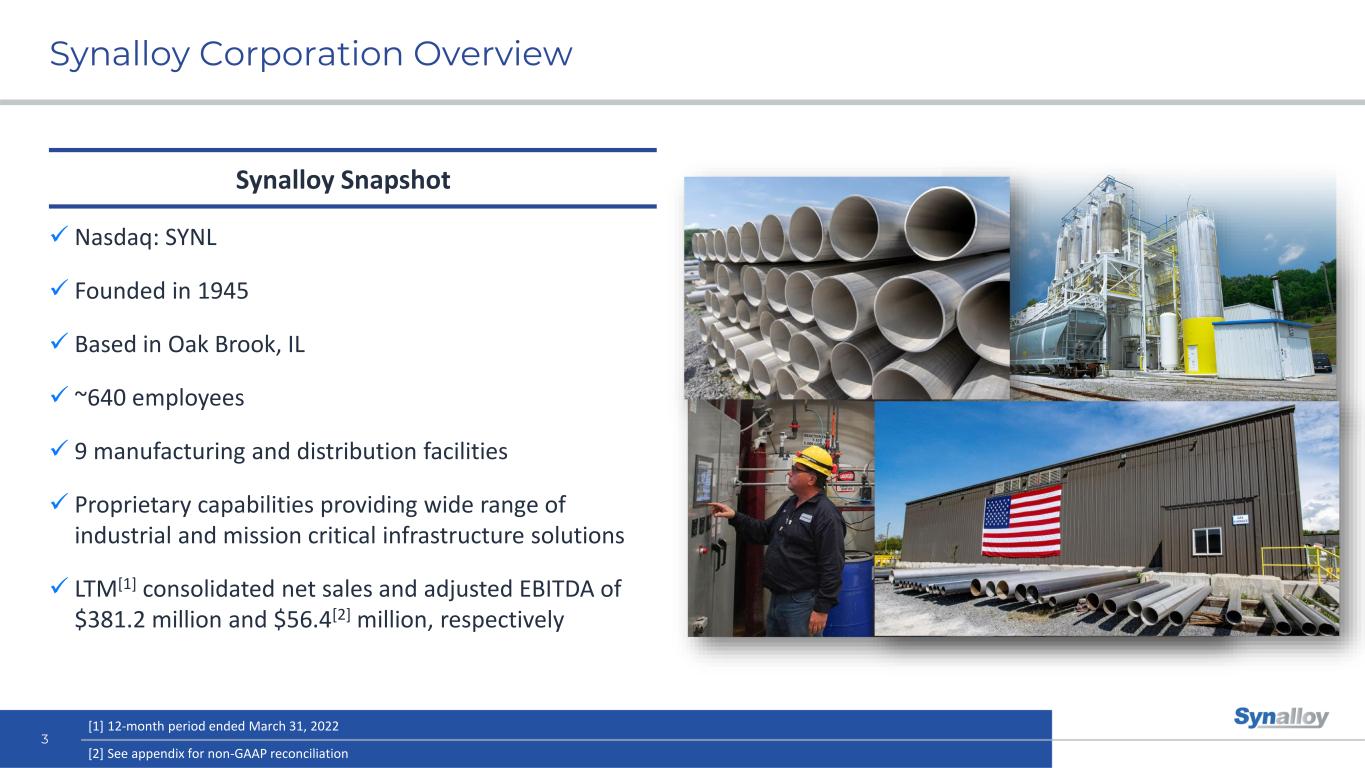
Synalloy Corporation Overview 3 ✓ Nasdaq: SYNL ✓ Founded in 1945 ✓ Based in Oak Brook, IL ✓ ~640 employees ✓ 9 manufacturing and distribution facilities ✓ Proprietary capabilities providing wide range of industrial and mission critical infrastructure solutions ✓ LTM[1] consolidated net sales and adjusted EBITDA of $381.2 million and $56.4[2] million, respectively Synalloy Snapshot [1] 12-month period ended March 31, 2022 [2] See appendix for non-GAAP reconciliation
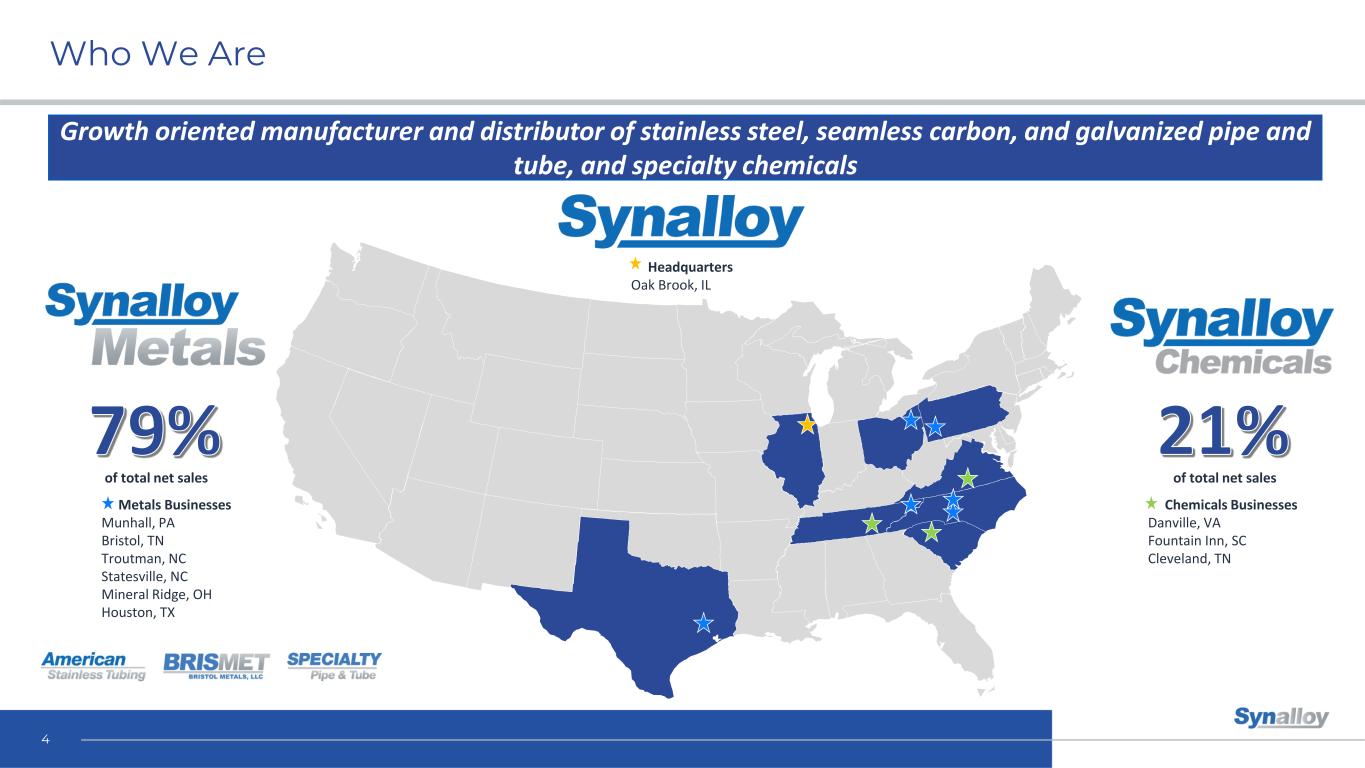
Who We Are Metals Businesses Munhall, PA Bristol, TN Troutman, NC Statesville, NC Mineral Ridge, OH Houston, TX Chemicals Businesses Danville, VA Fountain Inn, SC Cleveland, TN Headquarters Oak Brook, IL of total net salesof total net sales 4 Growth oriented manufacturer and distributor of stainless steel, seamless carbon, and galvanized pipe and tube, and specialty chemicals
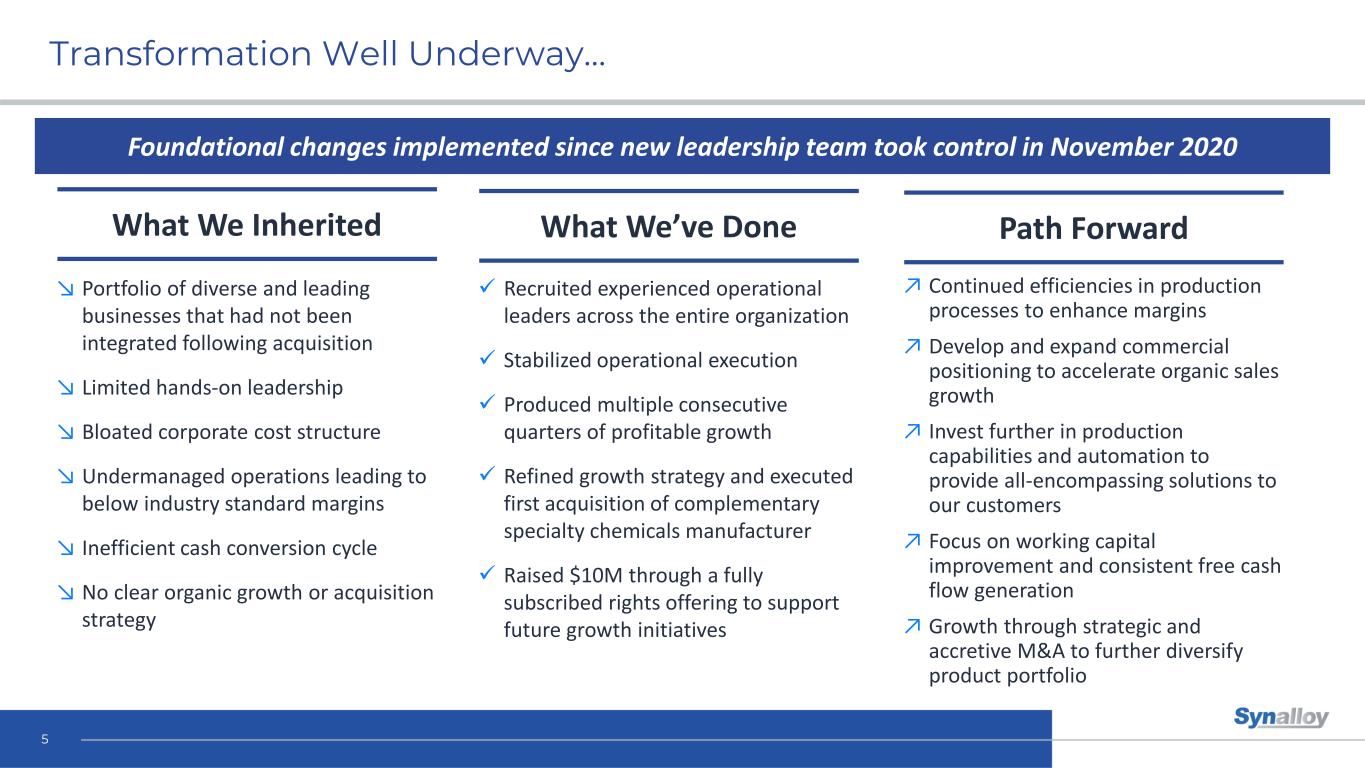
Transformation Well Underway… 5 Foundational changes implemented since new leadership team took control in November 2020 What We Inherited Path ForwardWhat We’ve Done ↘ Portfolio of diverse and leading businesses that had not been integrated following acquisition ↘ Limited hands-on leadership ↘ Bloated corporate cost structure ↘ Undermanaged operations leading to below industry standard margins ↘ Inefficient cash conversion cycle ↘ No clear organic growth or acquisition strategy ↗ Continued efficiencies in production processes to enhance margins ↗ Develop and expand commercial positioning to accelerate organic sales growth ↗ Invest further in production capabilities and automation to provide all-encompassing solutions to our customers ↗ Focus on working capital improvement and consistent free cash flow generation ↗ Growth through strategic and accretive M&A to further diversify product portfolio ✓ Recruited experienced operational leaders across the entire organization ✓ Stabilized operational execution ✓ Produced multiple consecutive quarters of profitable growth ✓ Refined growth strategy and executed first acquisition of complementary specialty chemicals manufacturer ✓ Raised $10M through a fully subscribed rights offering to support future growth initiatives
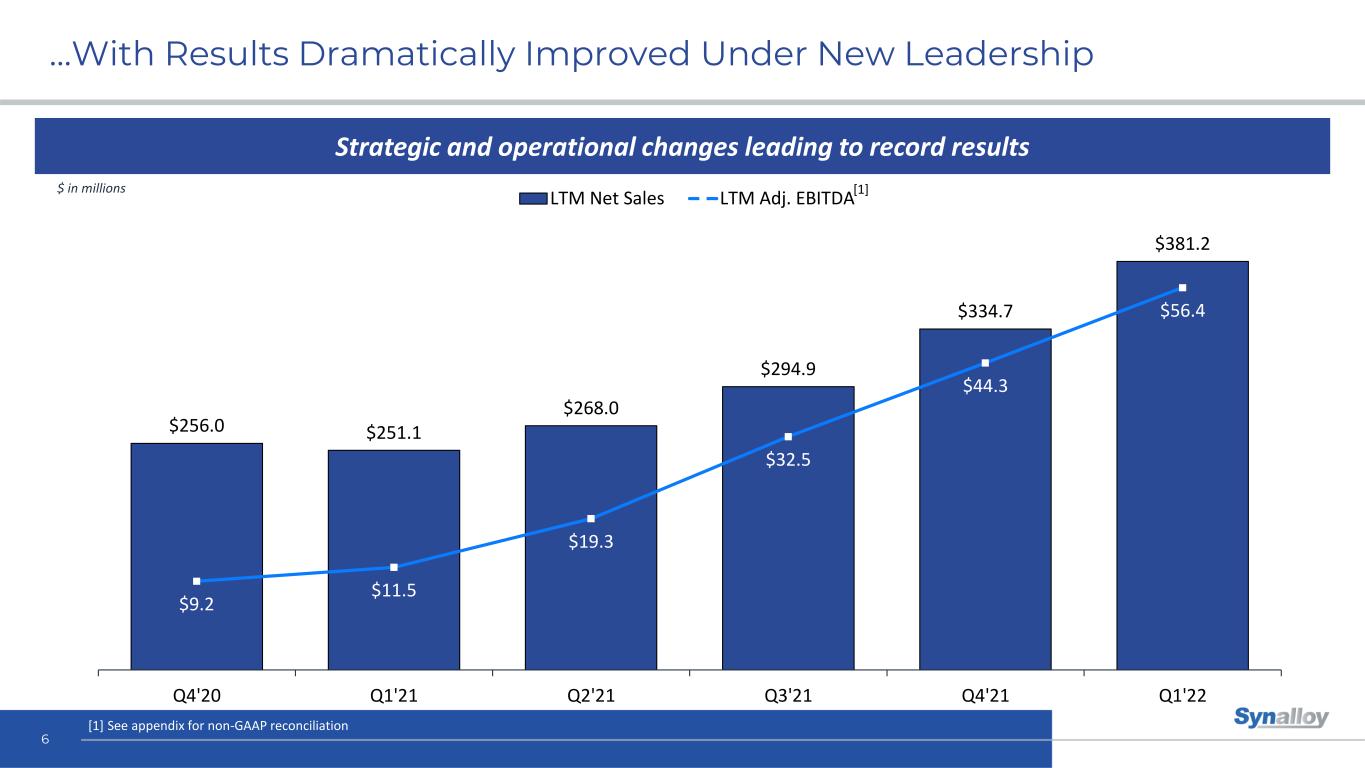
…With Results Dramatically Improved Under New Leadership Strategic and operational changes leading to record results 6 $256.0 $251.1 $268.0 $294.9 $334.7 $381.2 $9.2 $11.5 $19.3 $32.5 $44.3 $56.4 Q4'20 Q1'21 Q2'21 Q3'21 Q4'21 Q1'22 LTM Net Sales LTM Adj. EBITDA $ in millions [1] See appendix for non-GAAP reconciliation [1]
Synalloy Metals
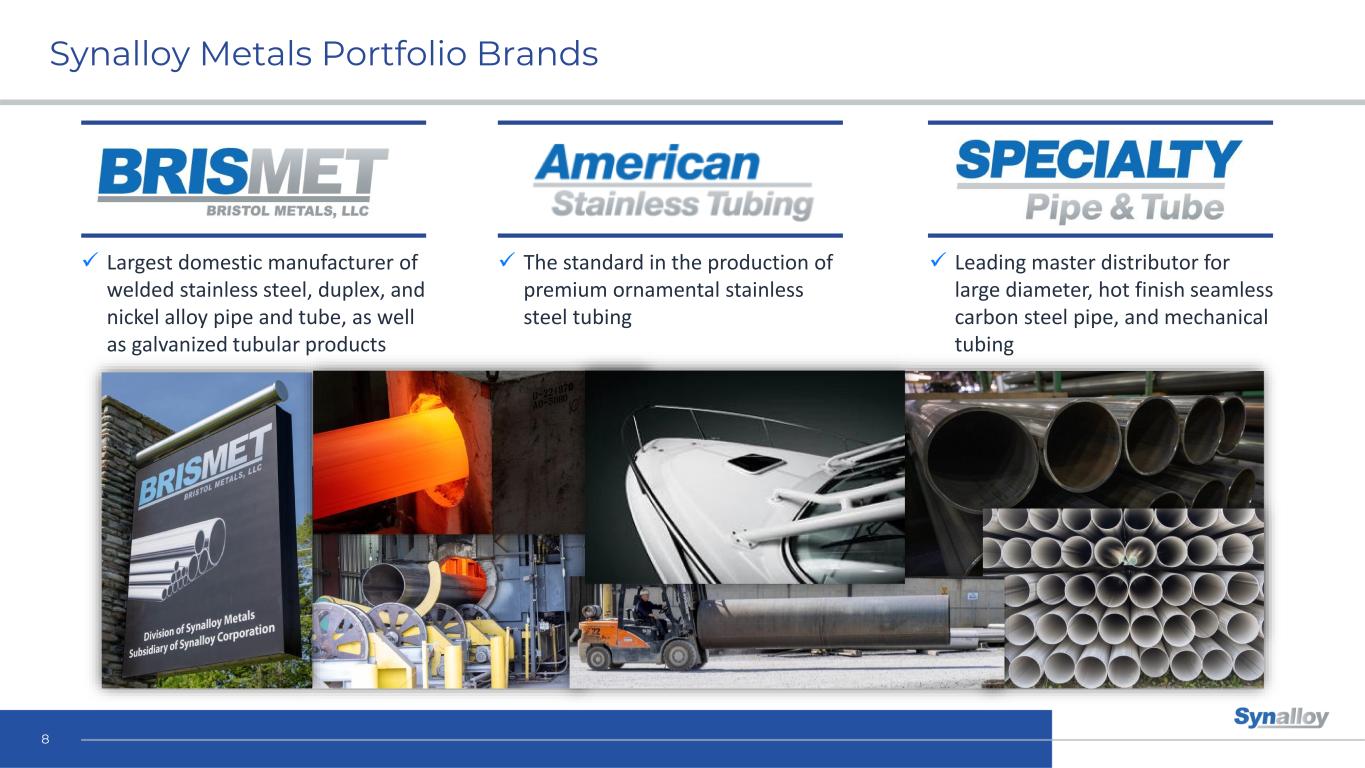
Synalloy Metals Portfolio Brands 8 ✓ Largest domestic manufacturer of welded stainless steel, duplex, and nickel alloy pipe and tube, as well as galvanized tubular products ✓ The standard in the production of premium ornamental stainless steel tubing ✓ Leading master distributor for large diameter, hot finish seamless carbon steel pipe, and mechanical tubing
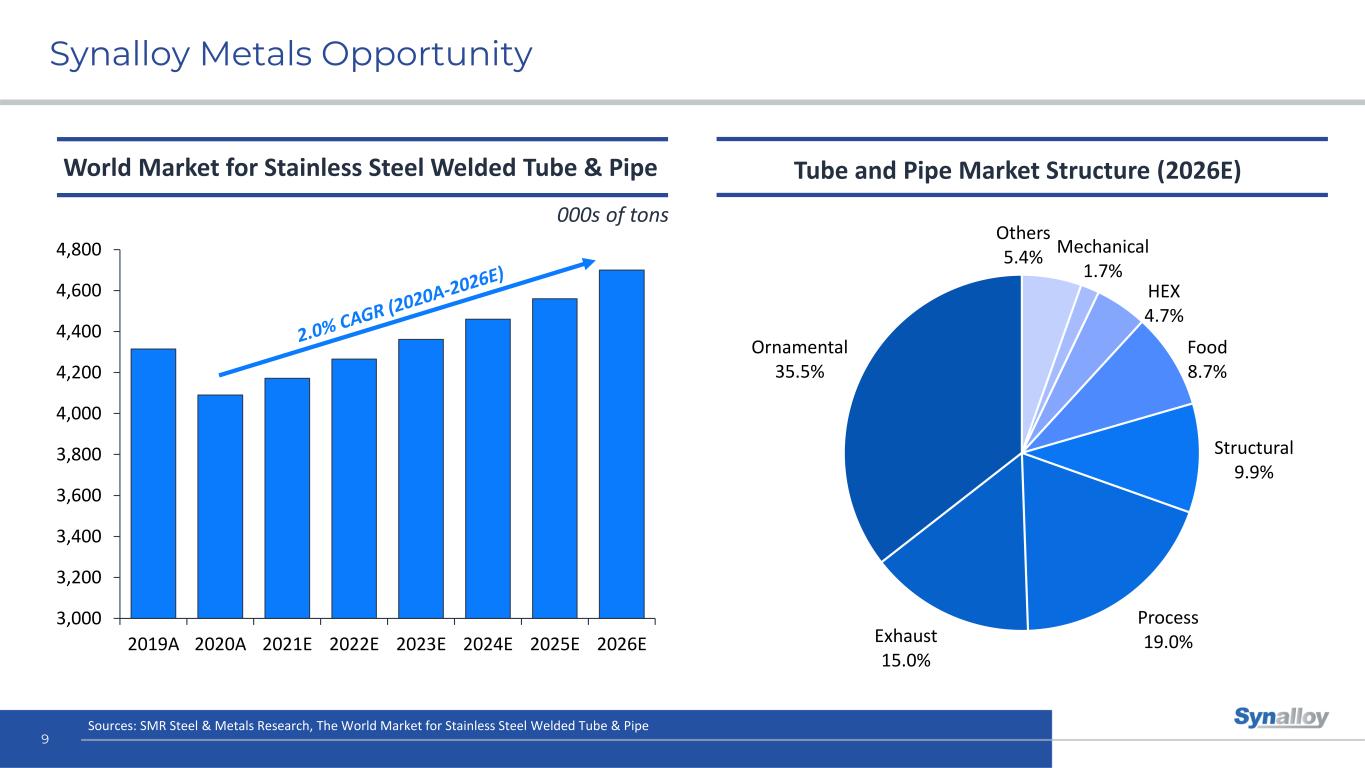
3,000 3,200 3,400 3,600 3,800 4,000 4,200 4,400 4,600 4,800 2019A 2020A 2021E 2022E 2023E 2024E 2025E 2026E Synalloy Metals Opportunity 9 World Market for Stainless Steel Welded Tube & Pipe Tube and Pipe Market Structure (2026E) 000s of tons Sources: SMR Steel & Metals Research, The World Market for Stainless Steel Welded Tube & Pipe Others 5.4% Mechanical 1.7% HEX 4.7% Food 8.7% Structural 9.9% Process 19.0%Exhaust 15.0% Ornamental 35.5%
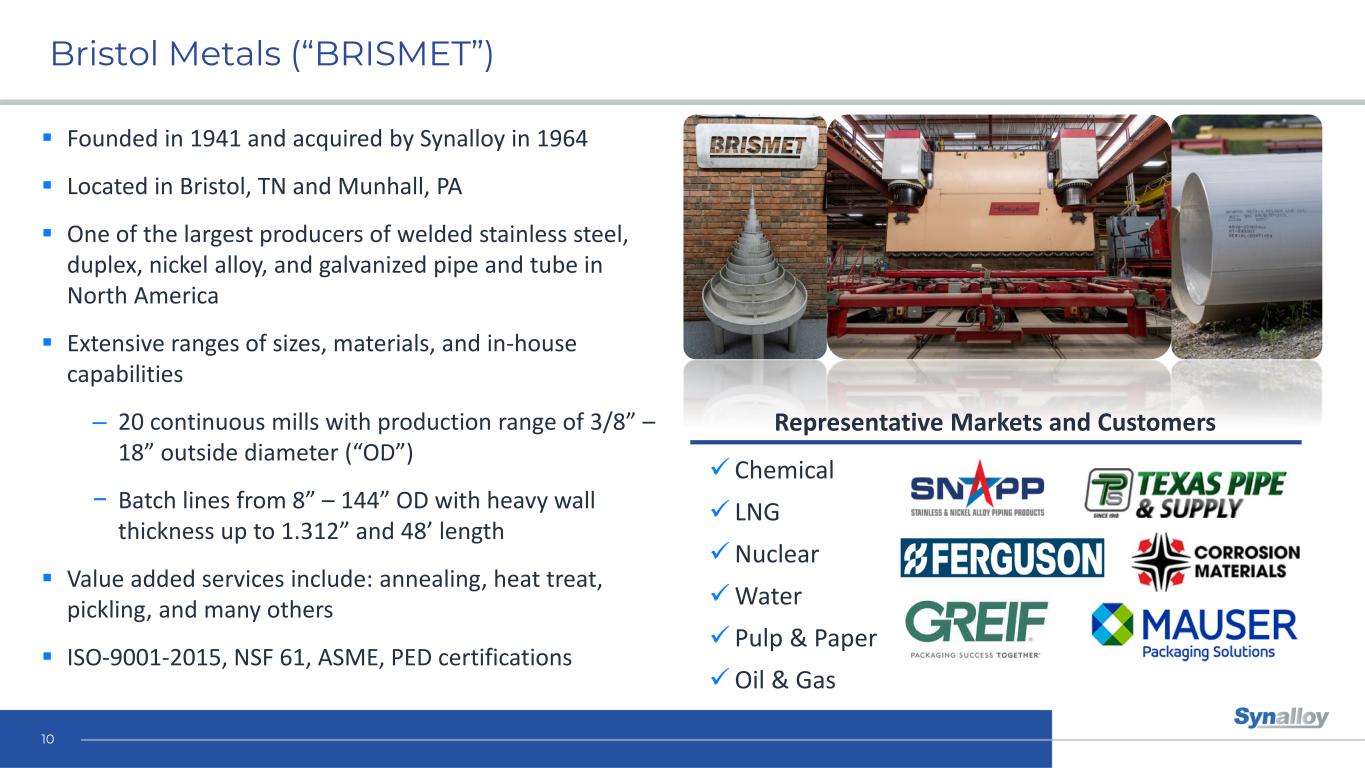
Bristol Metals (“BRISMET”) 10 ▪ Founded in 1941 and acquired by Synalloy in 1964 ▪ Located in Bristol, TN and Munhall, PA ▪ One of the largest producers of welded stainless steel, duplex, nickel alloy, and galvanized pipe and tube in North America ▪ Extensive ranges of sizes, materials, and in-house capabilities – 20 continuous mills with production range of 3/8” – 18” outside diameter (“OD”) − Batch lines from 8” – 144” OD with heavy wall thickness up to 1.312” and 48’ length ▪ Value added services include: annealing, heat treat, pickling, and many others ▪ ISO-9001-2015, NSF 61, ASME, PED certifications Representative Markets and Customers ✓ Chemical ✓ LNG ✓Nuclear ✓Water ✓ Pulp & Paper ✓Oil & Gas
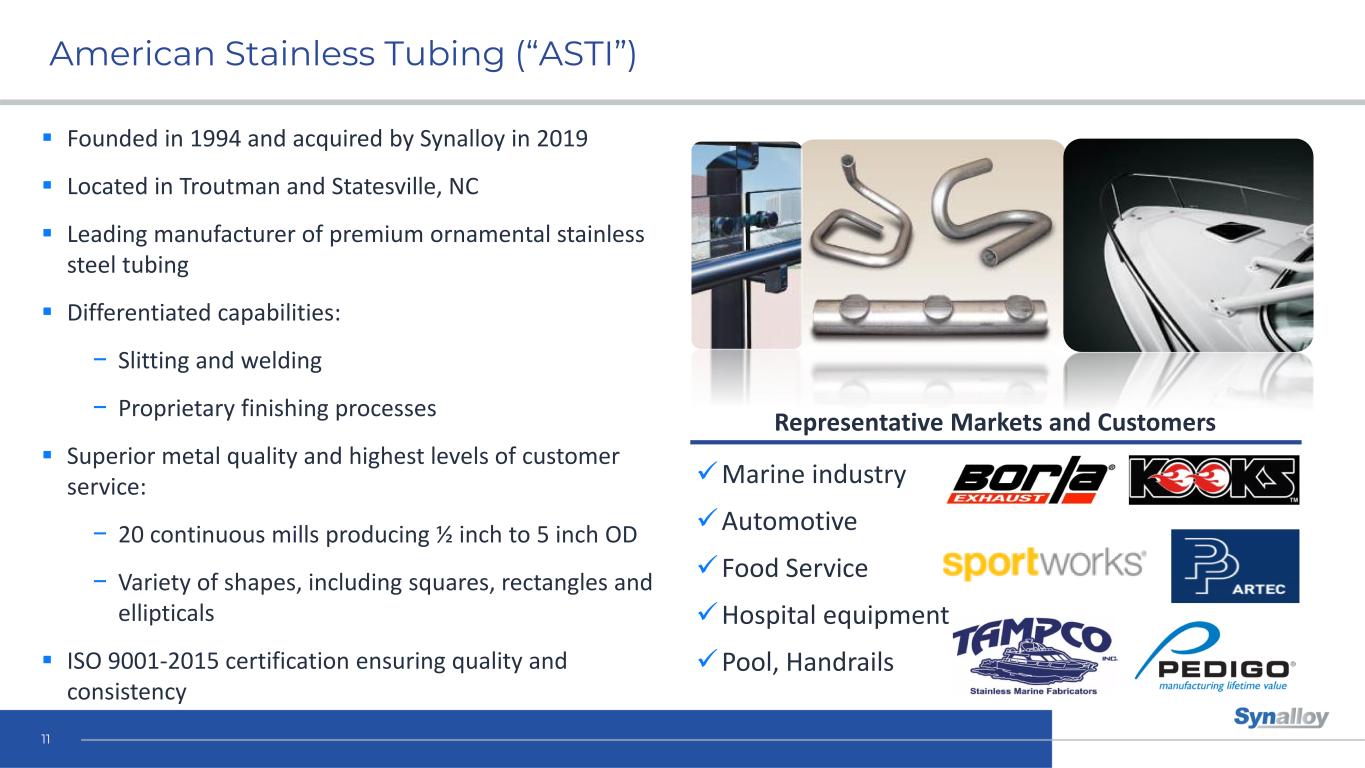
American Stainless Tubing (“ASTI”) 11 ▪ Founded in 1994 and acquired by Synalloy in 2019 ▪ Located in Troutman and Statesville, NC ▪ Leading manufacturer of premium ornamental stainless steel tubing ▪ Differentiated capabilities: − Slitting and welding − Proprietary finishing processes ▪ Superior metal quality and highest levels of customer service: − 20 continuous mills producing ½ inch to 5 inch OD − Variety of shapes, including squares, rectangles and ellipticals ▪ ISO 9001-2015 certification ensuring quality and consistency Representative Markets and Customers ✓Marine industry ✓Automotive ✓Food Service ✓Hospital equipment ✓Pool, Handrails
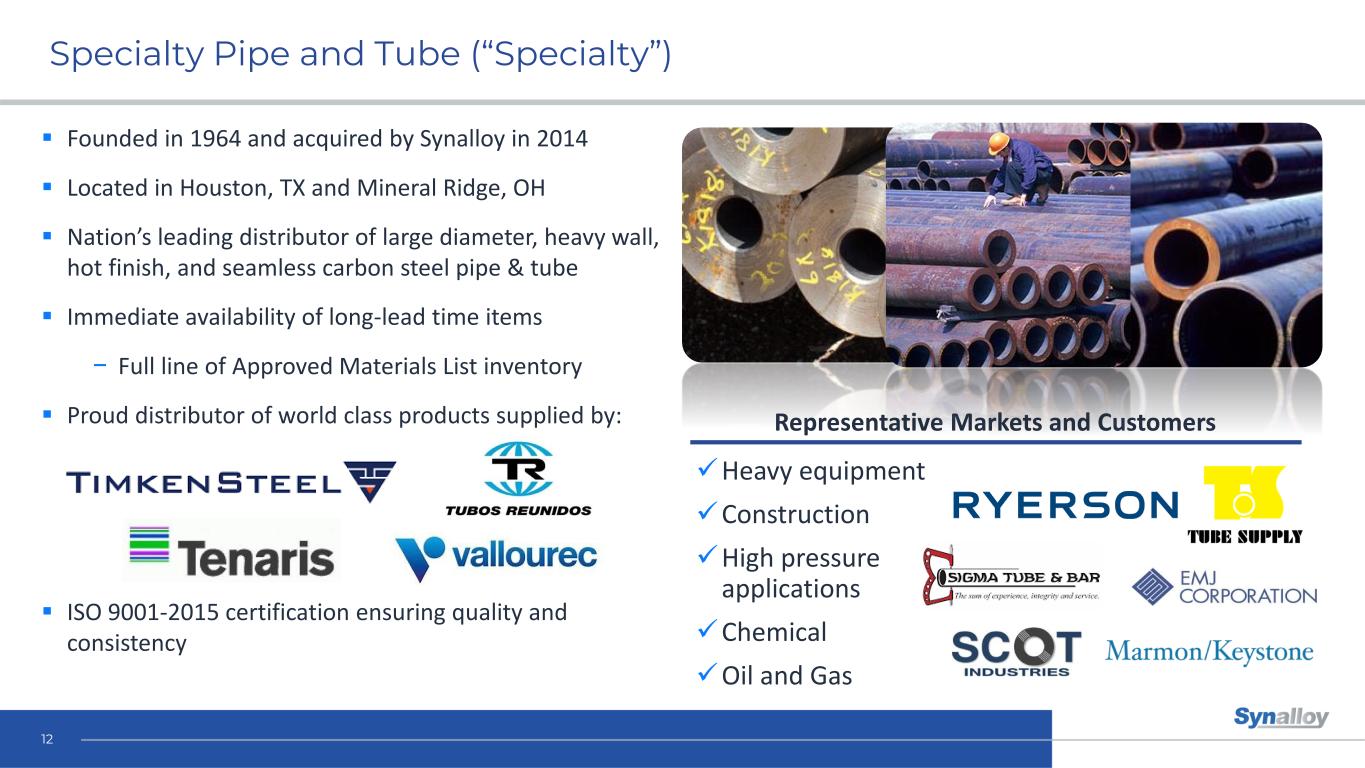
Specialty Pipe and Tube (“Specialty”) 12 ▪ Founded in 1964 and acquired by Synalloy in 2014 ▪ Located in Houston, TX and Mineral Ridge, OH ▪ Nation’s leading distributor of large diameter, heavy wall, hot finish, and seamless carbon steel pipe & tube ▪ Immediate availability of long-lead time items − Full line of Approved Materials List inventory ▪ Proud distributor of world class products supplied by: ▪ ISO 9001-2015 certification ensuring quality and consistency Representative Markets and Customers ✓Heavy equipment ✓Construction ✓High pressure applications ✓Chemical ✓Oil and Gas
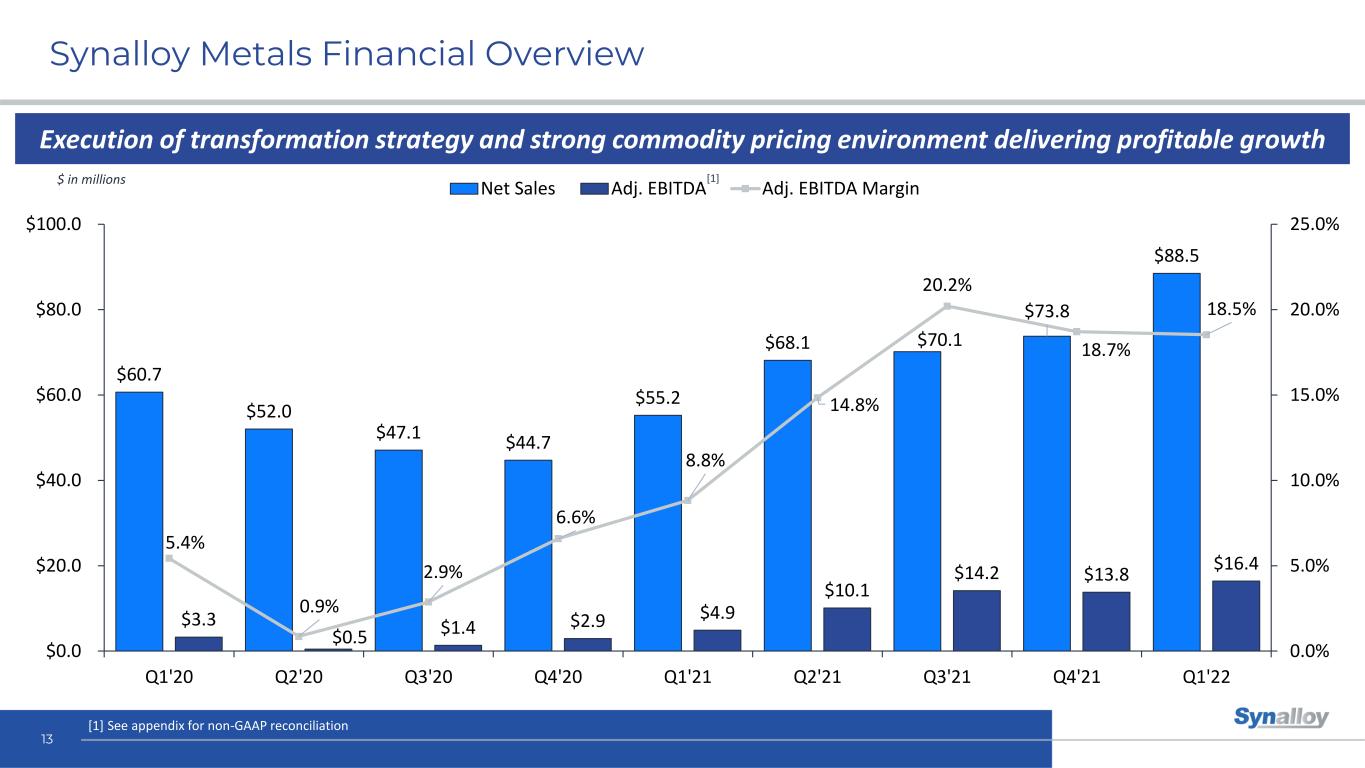
$60.7 $52.0 $47.1 $44.7 $55.2 $68.1 $70.1 $73.8 $88.5 $3.3 $0.5 $1.4 $2.9 $4.9 $10.1 $14.2 $13.8 $16.4 5.4% 0.9% 2.9% 6.6% 8.8% 14.8% 20.2% 18.7% 18.5% 0.0% 5.0% 10.0% 15.0% 20.0% 25.0% $0.0 $20.0 $40.0 $60.0 $80.0 $100.0 Q1'20 Q2'20 Q3'20 Q4'20 Q1'21 Q2'21 Q3'21 Q4'21 Q1'22 Net Sales Adj. EBITDA Adj. EBITDA Margin Synalloy Metals Financial Overview 13 Execution of transformation strategy and strong commodity pricing environment delivering profitable growth $ in millions [1] See appendix for non-GAAP reconciliation [1]
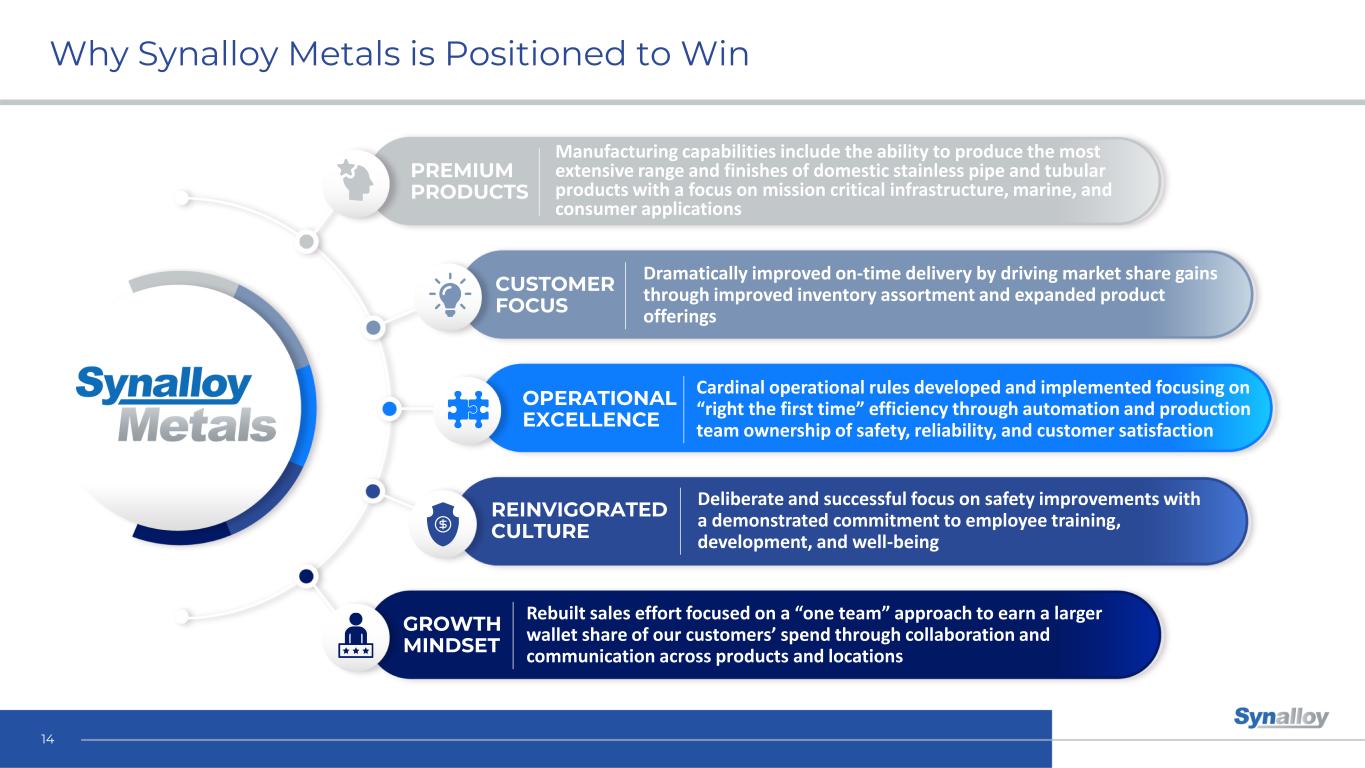
Why Synalloy Metals is Positioned to Win 14 Cardinal operational rules developed and implemented focusing on “right the first time” efficiency through automation and production team ownership of safety, reliability, and customer satisfaction Dramatically improved on-time delivery by driving market share gains through improved inventory assortment and expanded product offerings Manufacturing capabilities include the ability to produce the most extensive range and finishes of domestic stainless pipe and tubular products with a focus on mission critical infrastructure, marine, and consumer applications Deliberate and successful focus on safety improvements with a demonstrated commitment to employee training, development, and well-being Rebuilt sales effort focused on a “one team” approach to earn a larger wallet share of our customers’ spend through collaboration and communication across products and locations PREMIUM PRODUCTS CUSTOMER FOCUS OPERATIONAL EXCELLENCE GROWTH MINDSET REINVIGORATED CULTURE
Synalloy Chemicals
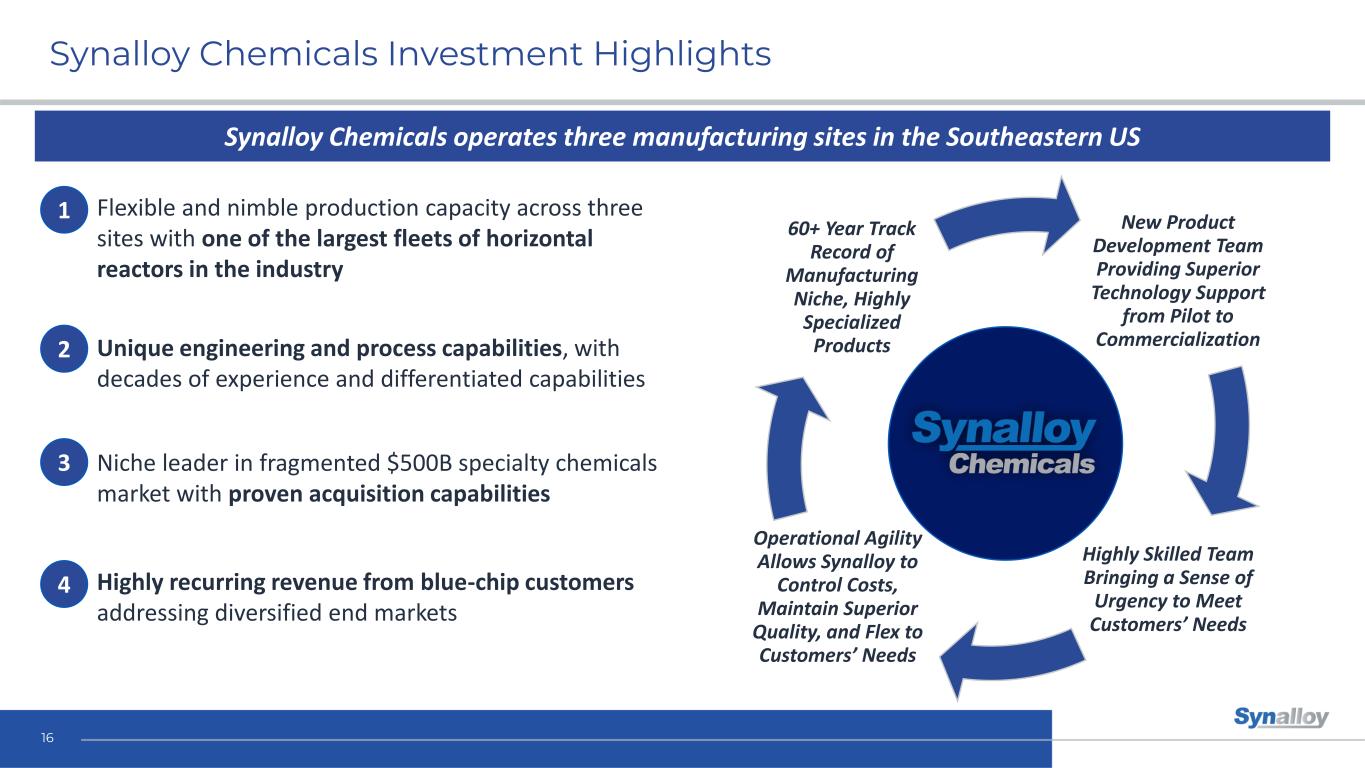
New Product Development Team Providing Superior Technology Support from Pilot to Commercialization Highly Skilled Team Bringing a Sense of Urgency to Meet Customers’ Needs Operational Agility Allows Synalloy to Control Costs, Maintain Superior Quality, and Flex to Customers’ Needs 60+ Year Track Record of Manufacturing Niche, Highly Specialized Products Synalloy Chemicals Investment Highlights 16 Synalloy Chemicals operates three manufacturing sites in the Southeastern US ▪ Niche leader in fragmented $500B specialty chemicals market with proven acquisition capabilities ▪ Unique engineering and process capabilities, with decades of experience and differentiated capabilities ▪ Flexible and nimble production capacity across three sites with one of the largest fleets of horizontal reactors in the industry ▪ Highly recurring revenue from blue-chip customers addressing diversified end markets 1 2 3 4
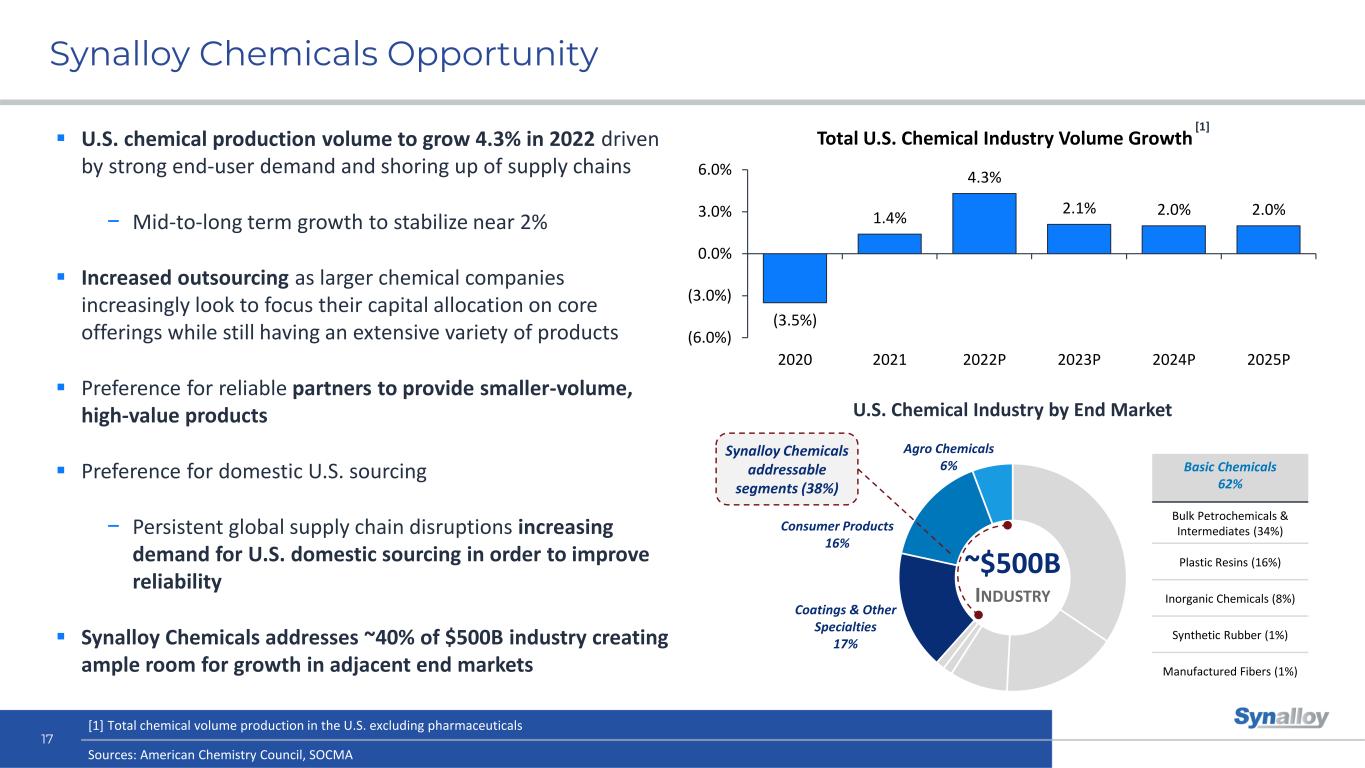
(3.5%) 1.4% 4.3% 2.1% 2.0% 2.0% (6.0%) (3.0%) 0.0% 3.0% 6.0% 2020 2021 2022P 2023P 2024P 2025P Total U.S. Chemical Industry Volume Growth Synalloy Chemicals Opportunity ▪ U.S. chemical production volume to grow 4.3% in 2022 driven by strong end-user demand and shoring up of supply chains − Mid-to-long term growth to stabilize near 2% ▪ Increased outsourcing as larger chemical companies increasingly look to focus their capital allocation on core offerings while still having an extensive variety of products ▪ Preference for reliable partners to provide smaller-volume, high-value products ▪ Preference for domestic U.S. sourcing − Persistent global supply chain disruptions increasing demand for U.S. domestic sourcing in order to improve reliability ▪ Synalloy Chemicals addresses ~40% of $500B industry creating ample room for growth in adjacent end markets 17 Sources: American Chemistry Council, SOCMA ~$500B INDUSTRY Synalloy Chemicals addressable segments (38%) Basic Chemicals 62% Bulk Petrochemicals & Intermediates (34%) Plastic Resins (16%) Inorganic Chemicals (8%) Synthetic Rubber (1%) Manufactured Fibers (1%) Agro Chemicals 6% Consumer Products 16% Coatings & Other Specialties 17% [1] Total chemical volume production in the U.S. excluding pharmaceuticals U.S. Chemical Industry by End Market [1]
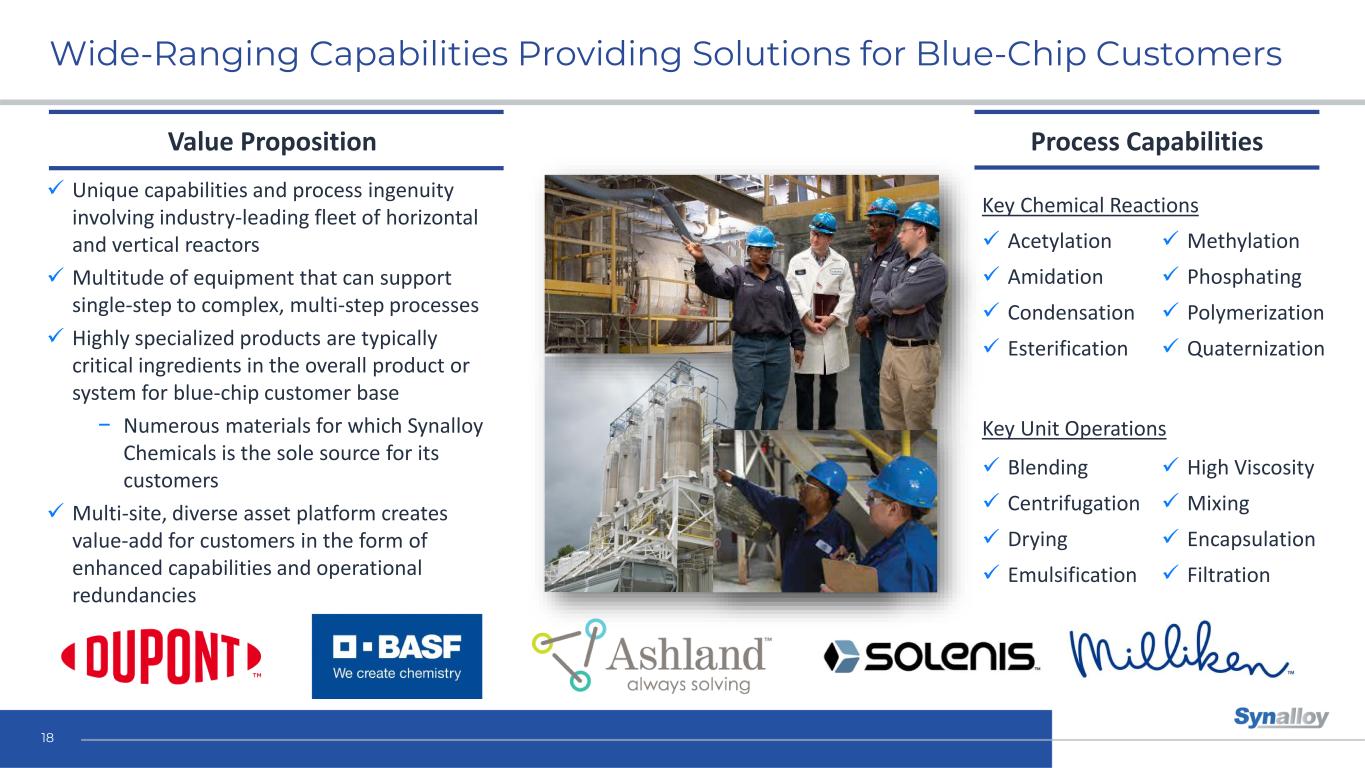
Wide-Ranging Capabilities Providing Solutions for Blue-Chip Customers Value Proposition Process Capabilities ✓ Unique capabilities and process ingenuity involving industry-leading fleet of horizontal and vertical reactors ✓ Multitude of equipment that can support single-step to complex, multi-step processes ✓ Highly specialized products are typically critical ingredients in the overall product or system for blue-chip customer base − Numerous materials for which Synalloy Chemicals is the sole source for its customers ✓ Multi-site, diverse asset platform creates value-add for customers in the form of enhanced capabilities and operational redundancies ✓ Acetylation ✓ Amidation ✓ Condensation ✓ Esterification ✓ Methylation ✓ Phosphating ✓ Polymerization ✓ Quaternization Key Chemical Reactions ✓ Blending ✓ Centrifugation ✓ Drying ✓ Emulsification ✓ High Viscosity ✓ Mixing ✓ Encapsulation ✓ Filtration Key Unit Operations 18
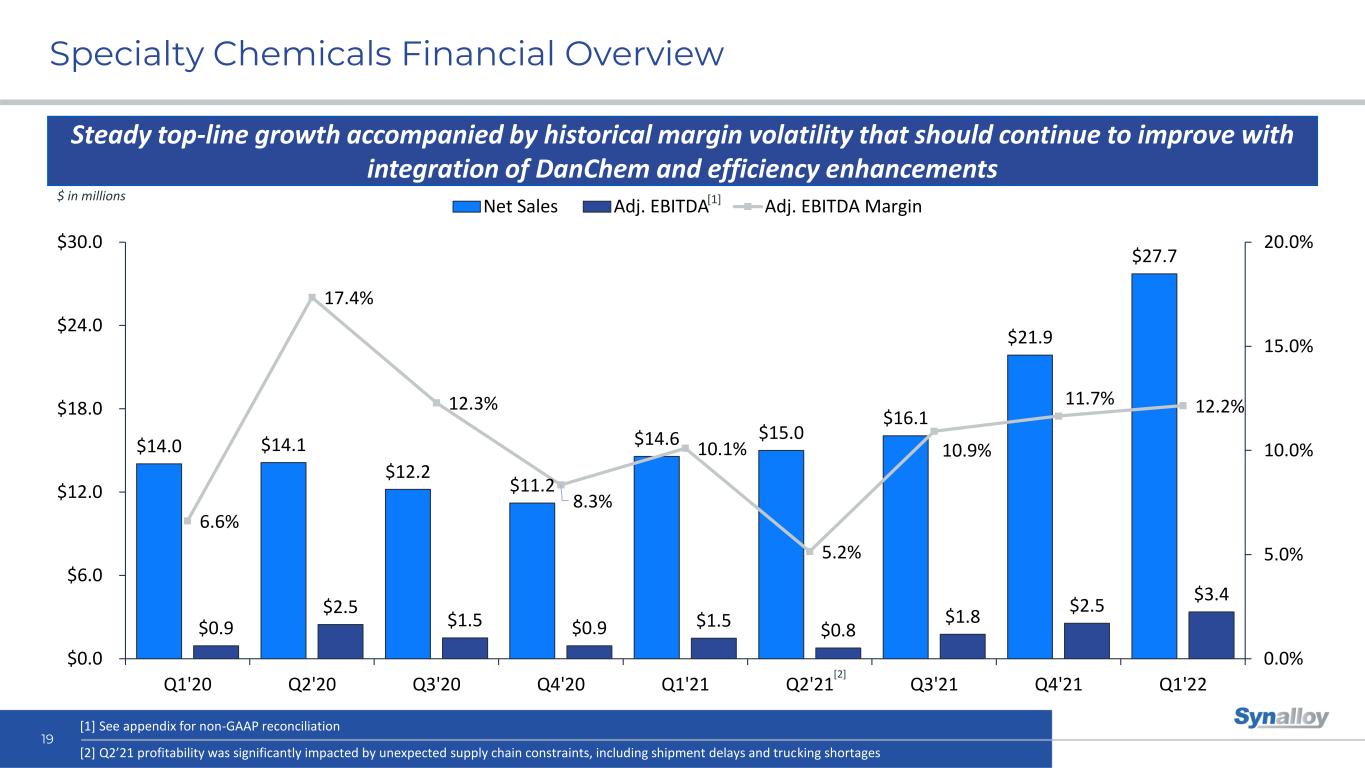
$14.0 $14.1 $12.2 $11.2 $14.6 $15.0 $16.1 $21.9 $27.7 $0.9 $2.5 $1.5 $0.9 $1.5 $0.8 $1.8 $2.5 $3.4 6.6% 17.4% 12.3% 8.3% 10.1% 5.2% 10.9% 11.7% 12.2% 0.0% 5.0% 10.0% 15.0% 20.0% $0.0 $6.0 $12.0 $18.0 $24.0 $30.0 Q1'20 Q2'20 Q3'20 Q4'20 Q1'21 Q2'21 Q3'21 Q4'21 Q1'22 Net Sales Adj. EBITDA Adj. EBITDA Margin Specialty Chemicals Financial Overview 19 [2] Steady top-line growth accompanied by historical margin volatility that should continue to improve with integration of DanChem and efficiency enhancements $ in millions [1] See appendix for non-GAAP reconciliation [1] [2] Q2’21 profitability was significantly impacted by unexpected supply chain constraints, including shipment delays and trucking shortages
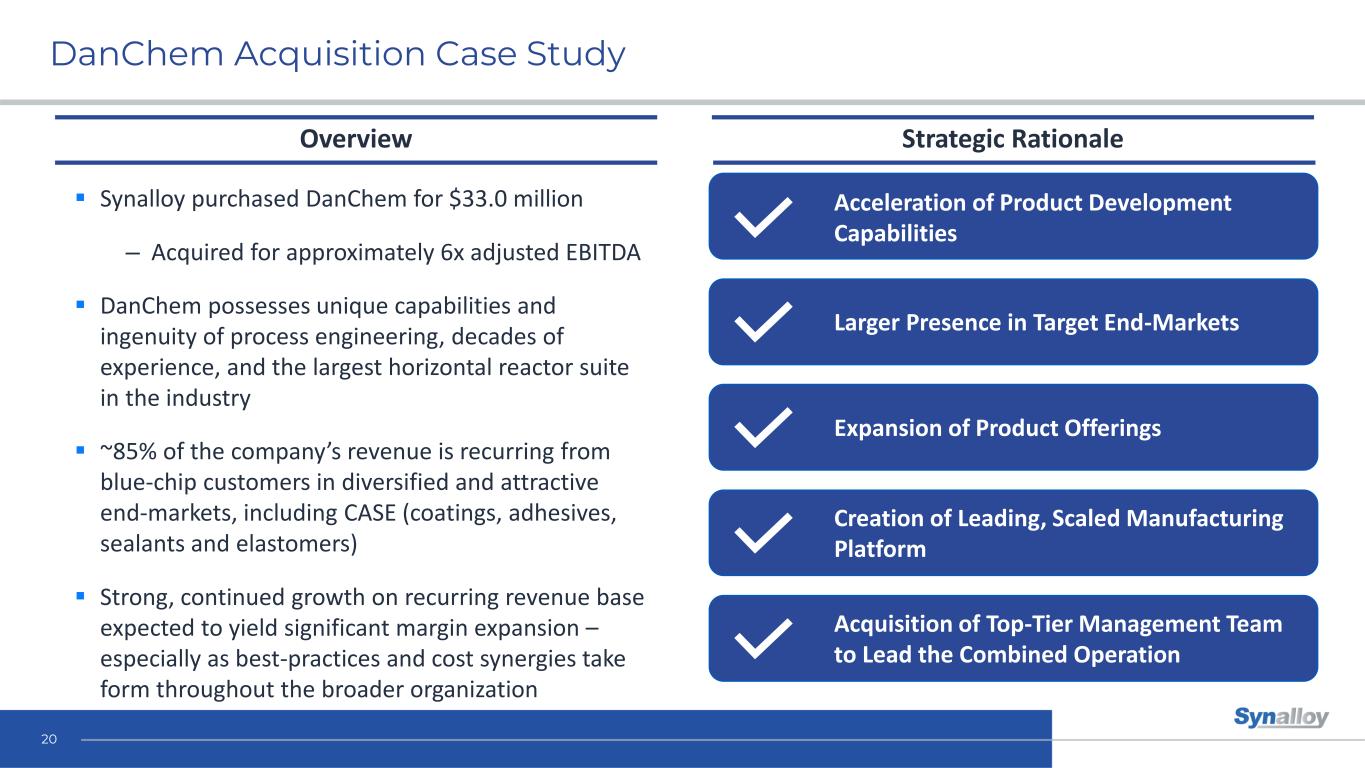
DanChem Acquisition Case Study ▪ Synalloy purchased DanChem for $33.0 million – Acquired for approximately 6x adjusted EBITDA ▪ DanChem possesses unique capabilities and ingenuity of process engineering, decades of experience, and the largest horizontal reactor suite in the industry ▪ ~85% of the company’s revenue is recurring from blue-chip customers in diversified and attractive end-markets, including CASE (coatings, adhesives, sealants and elastomers) ▪ Strong, continued growth on recurring revenue base expected to yield significant margin expansion – especially as best-practices and cost synergies take form throughout the broader organization Strategic Rationale Acceleration of Product Development Capabilities Larger Presence in Target End-Markets Expansion of Product Offerings Creation of Leading, Scaled Manufacturing Platform Overview Acquisition of Top-Tier Management Team to Lead the Combined Operation 20
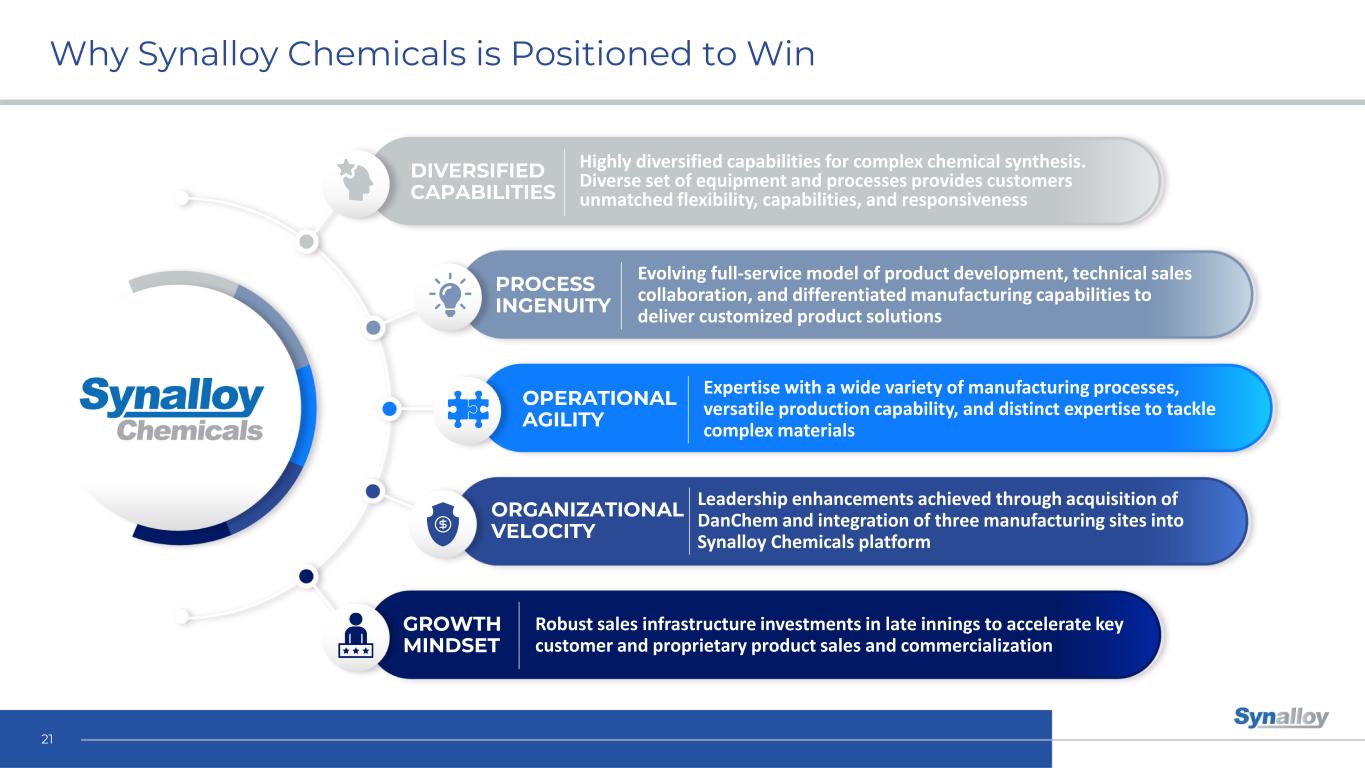
Why Synalloy Chemicals is Positioned to Win 21 Expertise with a wide variety of manufacturing processes, versatile production capability, and distinct expertise to tackle complex materials Evolving full-service model of product development, technical sales collaboration, and differentiated manufacturing capabilities to deliver customized product solutions Highly diversified capabilities for complex chemical synthesis. Diverse set of equipment and processes provides customers unmatched flexibility, capabilities, and responsiveness Leadership enhancements achieved through acquisition of DanChem and integration of three manufacturing sites into Synalloy Chemicals platform Robust sales infrastructure investments in late innings to accelerate key customer and proprietary product sales and commercialization DIVERSIFIED CAPABILITIES PROCESS INGENUITY OPERATIONAL AGILITY GROWTH MINDSET ORGANIZATIONAL VELOCITY
Driving Long-Term Shareholder Value
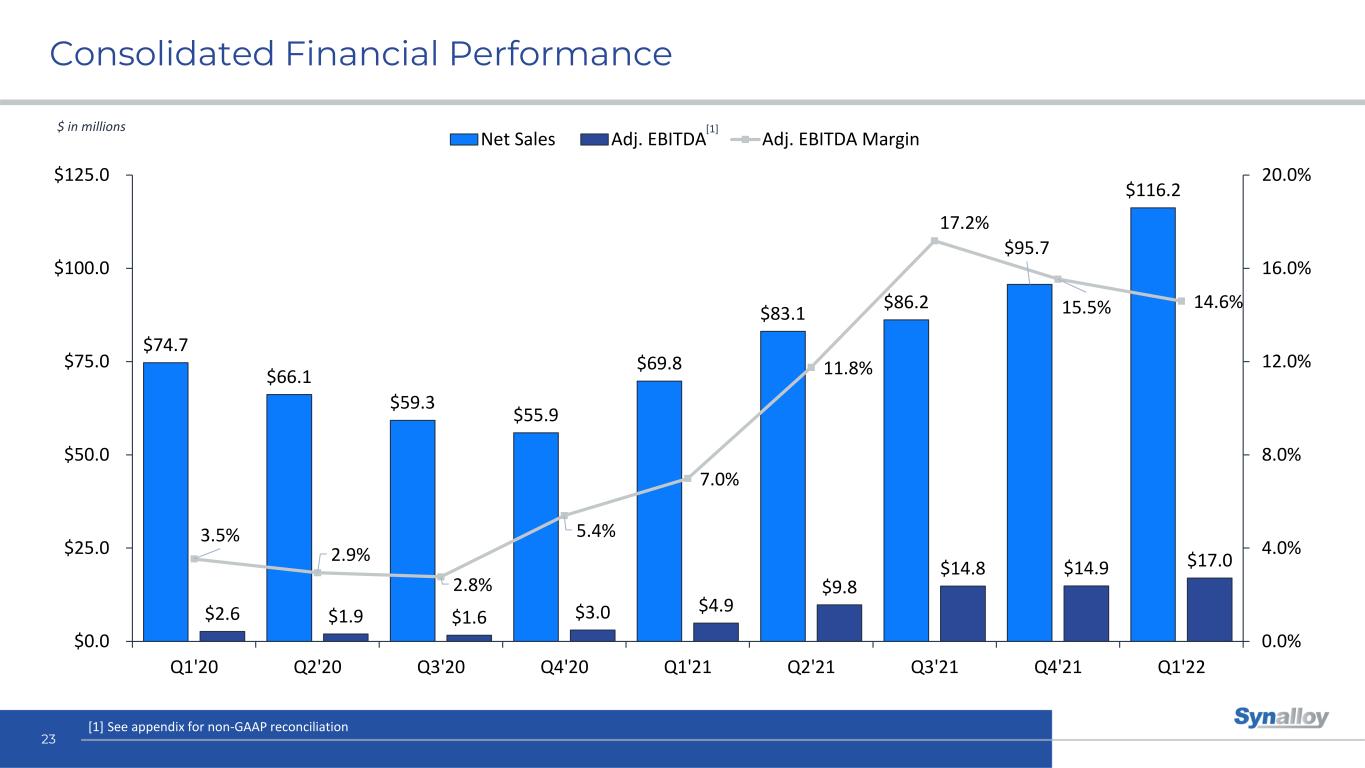
Consolidated Financial Performance 23 $ in millions [1] See appendix for non-GAAP reconciliation [1] $74.7 $66.1 $59.3 $55.9 $69.8 $83.1 $86.2 $95.7 $116.2 $2.6 $1.9 $1.6 $3.0 $4.9 $9.8 $14.8 $14.9 $17.0 3.5% 2.9% 2.8% 5.4% 7.0% 11.8% 17.2% 15.5% 14.6% 0.0% 4.0% 8.0% 12.0% 16.0% 20.0% $0.0 $25.0 $50.0 $75.0 $100.0 $125.0 Q1'20 Q2'20 Q3'20 Q4'20 Q1'21 Q2'21 Q3'21 Q4'21 Q1'22 Net Sales Adj. EBITDA Adj. EBITDA Margin
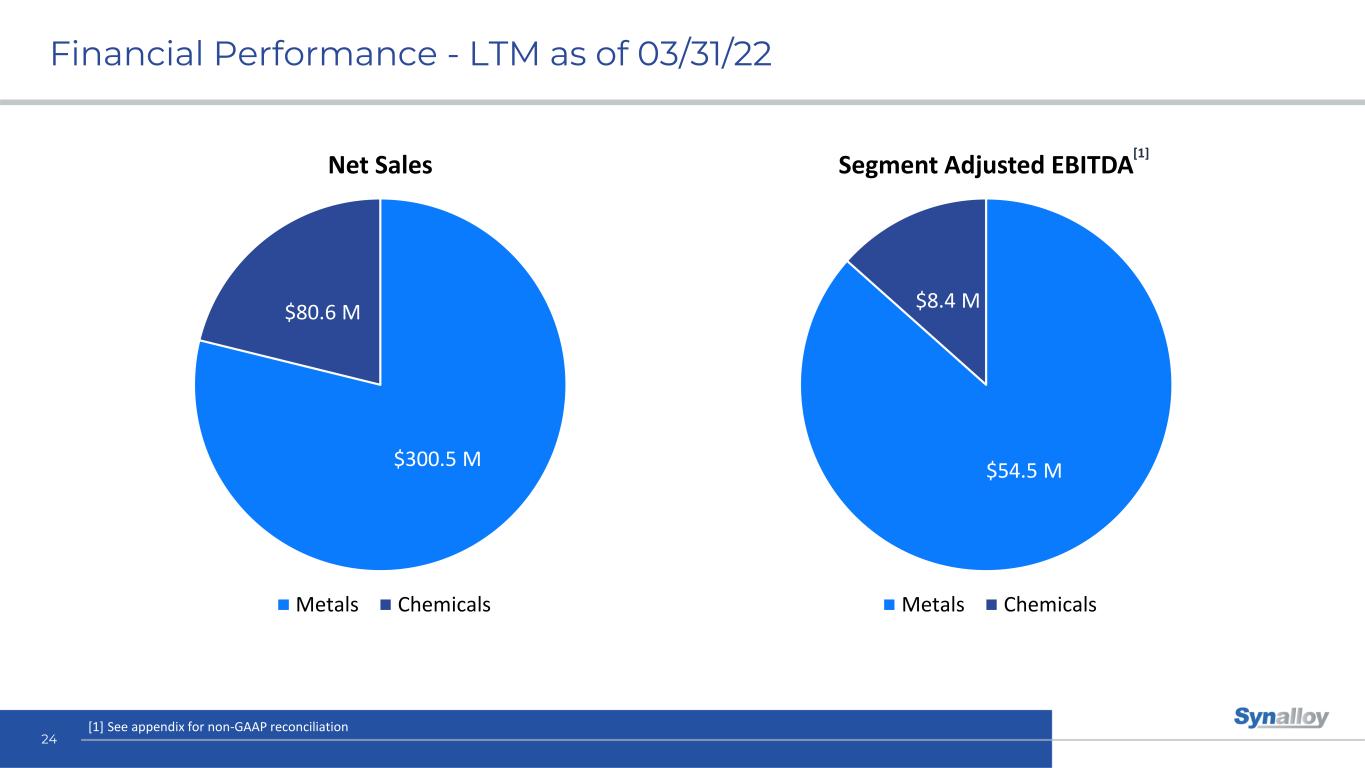
Financial Performance - LTM as of 03/31/22 24 $300.5 M $80.6 M Net Sales Metals Chemicals $54.5 M $8.4 M Segment Adjusted EBITDA Metals Chemicals [1] See appendix for non-GAAP reconciliation [1]
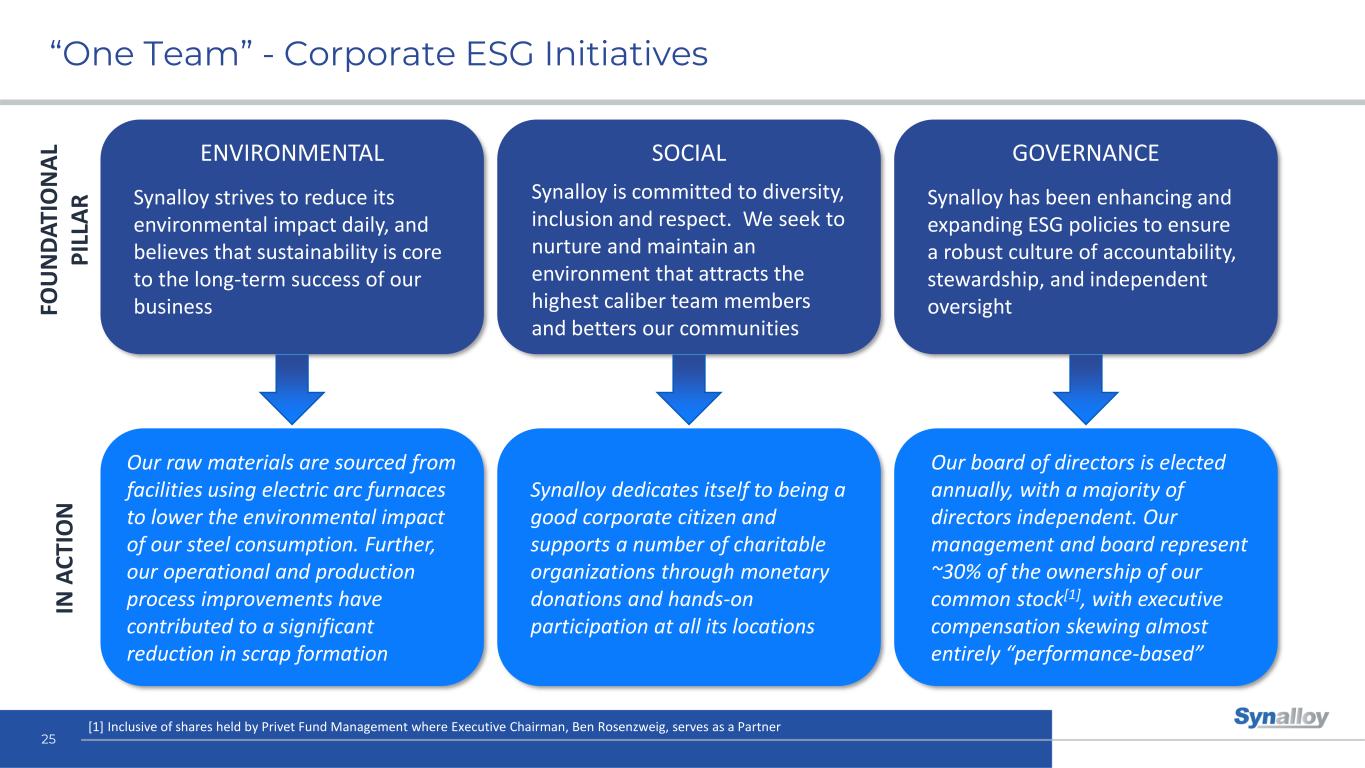
“One Team” - Corporate ESG Initiatives 25 ENVIRONMENTAL SOCIAL GOVERNANCE Synalloy has been enhancing and expanding ESG policies to ensure a robust culture of accountability, stewardship, and independent oversight Our board of directors is elected annually, with a majority of directors independent. Our management and board represent ~30% of the ownership of our common stock[1], with executive compensation skewing almost entirely “performance-based” Synalloy strives to reduce its environmental impact daily, and believes that sustainability is core to the long-term success of our business Our raw materials are sourced from facilities using electric arc furnaces to lower the environmental impact of our steel consumption. Further, our operational and production process improvements have contributed to a significant reduction in scrap formation IN A C TI O N FO U N D A TI O N A L P IL LA R Synalloy dedicates itself to being a good corporate citizen and supports a number of charitable organizations through monetary donations and hands-on participation at all its locations Synalloy is committed to diversity, inclusion and respect. We seek to nurture and maintain an environment that attracts the highest caliber team members and betters our communities [1] Inclusive of shares held by Privet Fund Management where Executive Chairman, Ben Rosenzweig, serves as a Partner
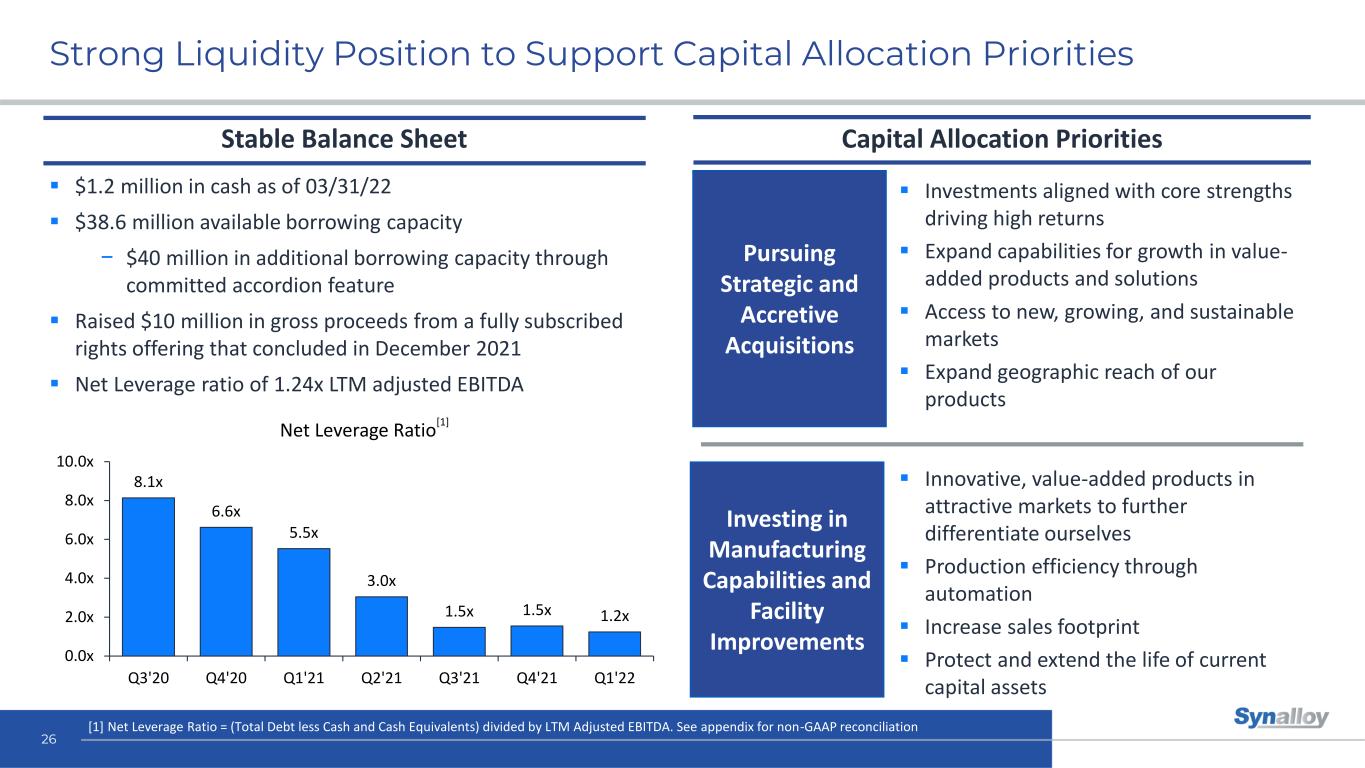
▪ $1.2 million in cash as of 03/31/22 ▪ $38.6 million available borrowing capacity − $40 million in additional borrowing capacity through committed accordion feature ▪ Raised $10 million in gross proceeds from a fully subscribed rights offering that concluded in December 2021 ▪ Net Leverage ratio of 1.24x LTM adjusted EBITDA 8.1x 6.6x 5.5x 3.0x 1.5x 1.5x 1.2x 0.0x 2.0x 4.0x 6.0x 8.0x 10.0x Q3'20 Q4'20 Q1'21 Q2'21 Q3'21 Q4'21 Q1'22 Net Leverage Ratio Strong Liquidity Position to Support Capital Allocation Priorities 26 ▪ Investments aligned with core strengths driving high returns ▪ Expand capabilities for growth in value- added products and solutions ▪ Access to new, growing, and sustainable markets ▪ Expand geographic reach of our products Pursuing Strategic and Accretive Acquisitions Investing in Manufacturing Capabilities and Facility Improvements ▪ Innovative, value-added products in attractive markets to further differentiate ourselves ▪ Production efficiency through automation ▪ Increase sales footprint ▪ Protect and extend the life of current capital assets Stable Balance Sheet Capital Allocation Priorities [1] [1] Net Leverage Ratio = (Total Debt less Cash and Cash Equivalents) divided by LTM Adjusted EBITDA. See appendix for non-GAAP reconciliation
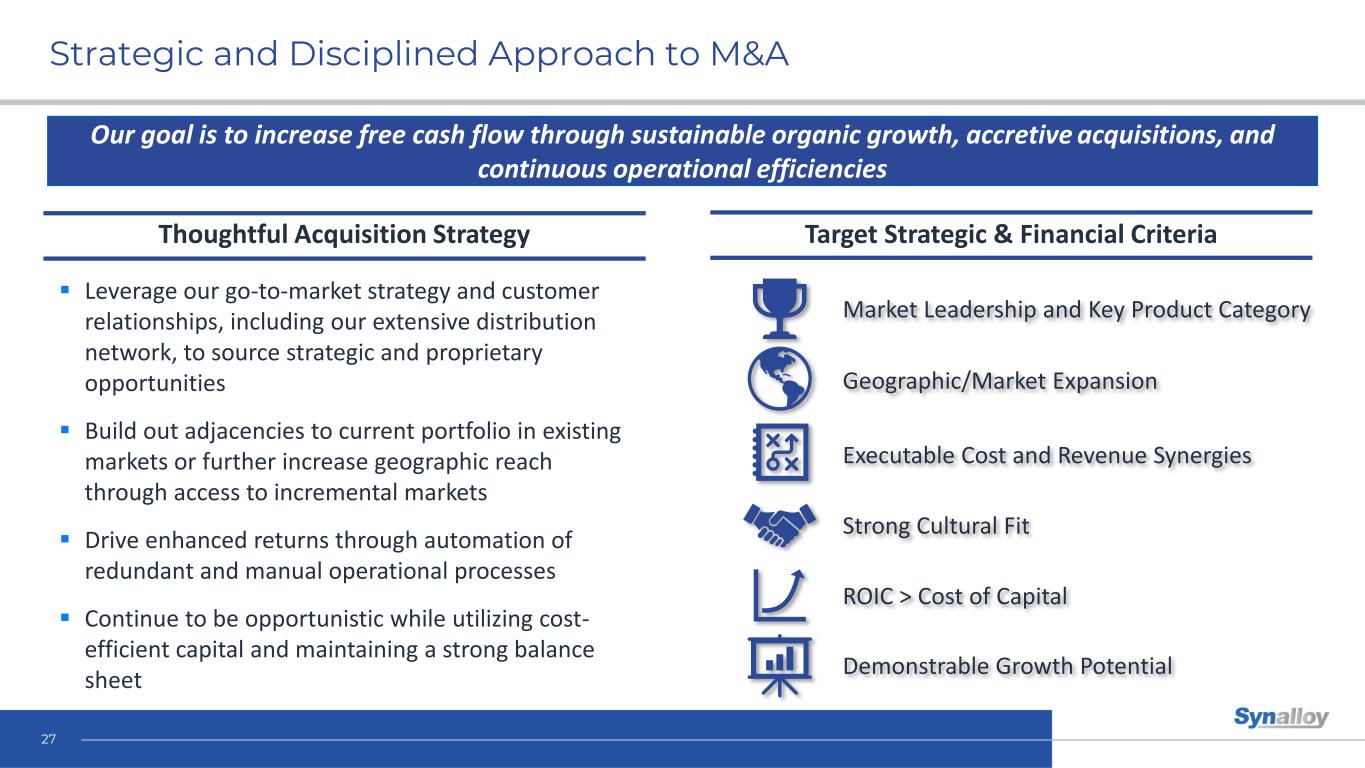
Strategic and Disciplined Approach to M&A 27 Our goal is to increase free cash flow through sustainable organic growth, accretive acquisitions, and continuous operational efficiencies ▪ Leverage our go-to-market strategy and customer relationships, including our extensive distribution network, to source strategic and proprietary opportunities ▪ Build out adjacencies to current portfolio in existing markets or further increase geographic reach through access to incremental markets ▪ Drive enhanced returns through automation of redundant and manual operational processes ▪ Continue to be opportunistic while utilizing cost- efficient capital and maintaining a strong balance sheet Thoughtful Acquisition Strategy Target Strategic & Financial Criteria Market Leadership and Key Product Category Geographic/Market Expansion Executable Cost and Revenue Synergies Strong Cultural Fit ROIC > Cost of Capital Demonstrable Growth Potential
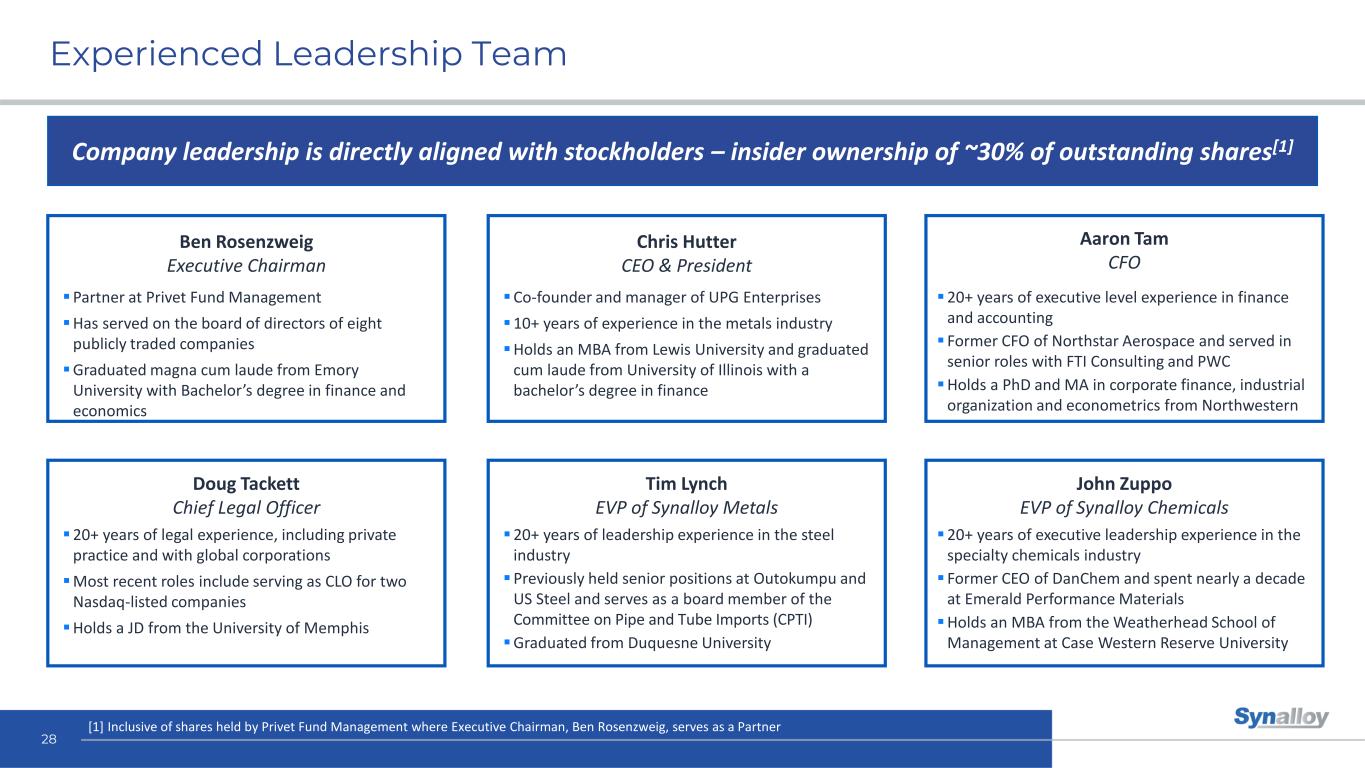
Experienced Leadership Team 28 Ben Rosenzweig Executive Chairman Chris Hutter CEO & President Aaron Tam CFO Doug Tackett Chief Legal Officer Tim Lynch EVP of Synalloy Metals John Zuppo EVP of Synalloy Chemicals ▪Partner at Privet Fund Management ▪Has served on the board of directors of eight publicly traded companies ▪Graduated magna cum laude from Emory University with Bachelor’s degree in finance and economics ▪Co-founder and manager of UPG Enterprises ▪10+ years of experience in the metals industry ▪Holds an MBA from Lewis University and graduated cum laude from University of Illinois with a bachelor’s degree in finance ▪20+ years of executive level experience in finance and accounting ▪ Former CFO of Northstar Aerospace and served in senior roles with FTI Consulting and PWC ▪Holds a PhD and MA in corporate finance, industrial organization and econometrics from Northwestern ▪20+ years of legal experience, including private practice and with global corporations ▪Most recent roles include serving as CLO for two Nasdaq-listed companies ▪Holds a JD from the University of Memphis ▪20+ years of leadership experience in the steel industry ▪Previously held senior positions at Outokumpu and US Steel and serves as a board member of the Committee on Pipe and Tube Imports (CPTI) ▪Graduated from Duquesne University ▪20+ years of executive leadership experience in the specialty chemicals industry ▪ Former CEO of DanChem and spent nearly a decade at Emerald Performance Materials ▪Holds an MBA from the Weatherhead School of Management at Case Western Reserve University Company leadership is directly aligned with stockholders – insider ownership of ~30% of outstanding shares[1] [1] Inclusive of shares held by Privet Fund Management where Executive Chairman, Ben Rosenzweig, serves as a Partner
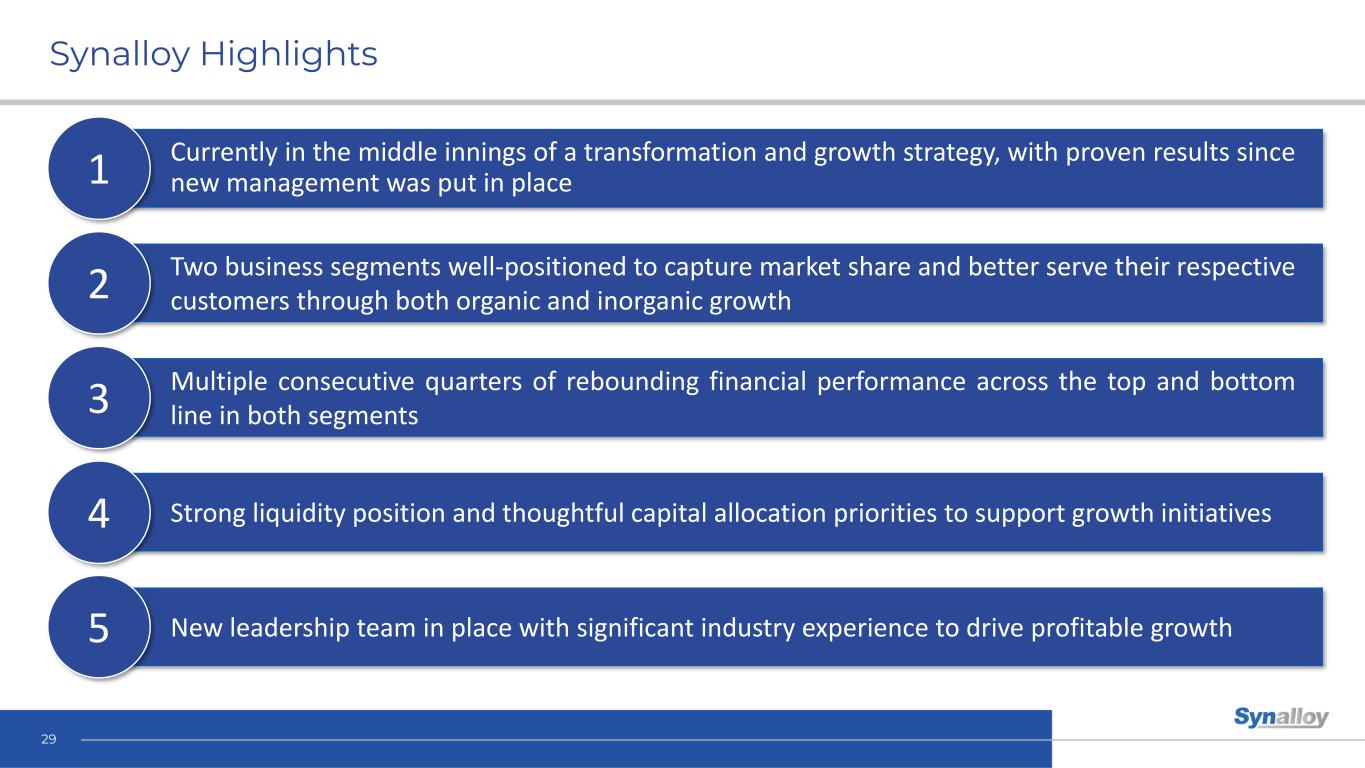
Synalloy Highlights 29 1 2 3 4 5 Currently in the middle innings of a transformation and growth strategy, with proven results since new management was put in place Two business segments well-positioned to capture market share and better serve their respective customers through both organic and inorganic growth Multiple consecutive quarters of rebounding financial performance across the top and bottom line in both segments Strong liquidity position and thoughtful capital allocation priorities to support growth initiatives New leadership team in place with significant industry experience to drive profitable growth
30 Contact Us Aaron Tam Chief Financial Officer 1-804-822-3260 Cody Slach or Cody Cree Gateway Group 1-949-574-3860 SYNL@gatewayir.com
Appendix
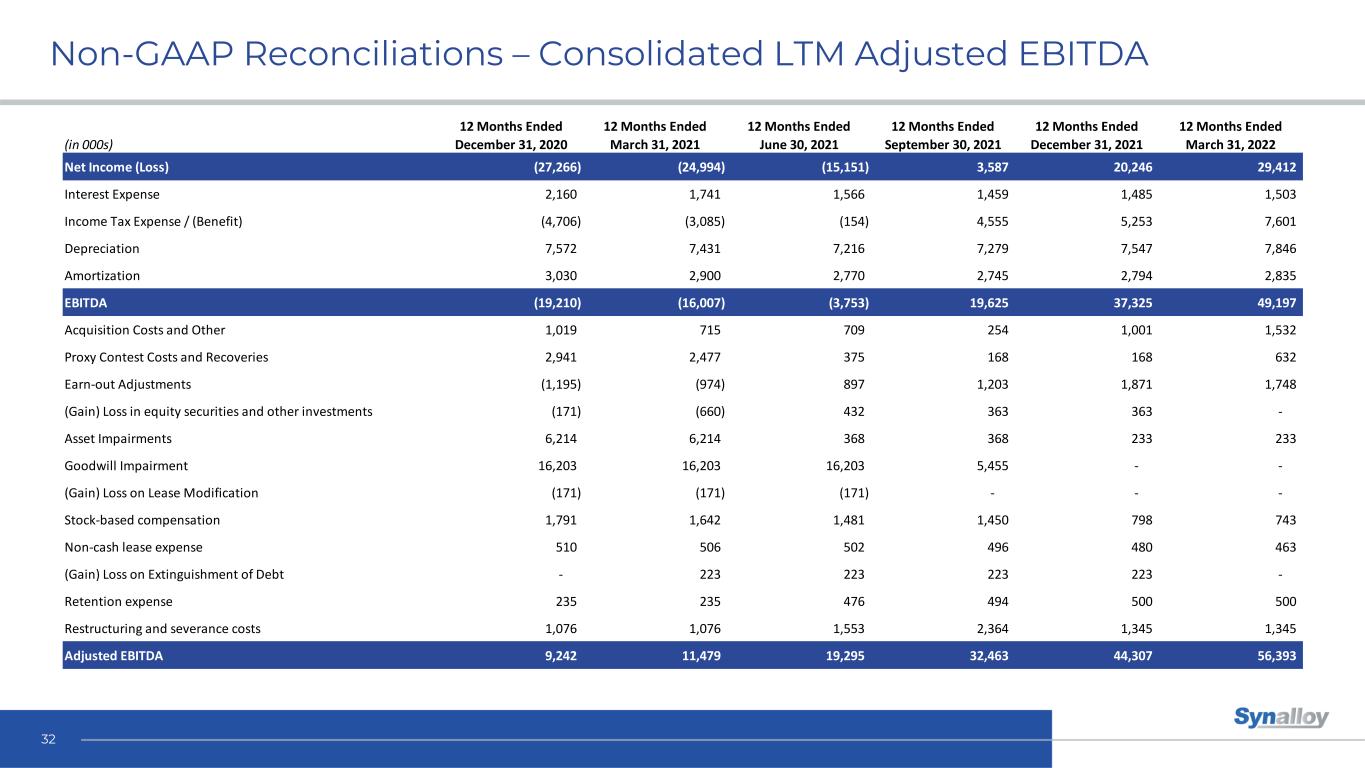
Non-GAAP Reconciliations – Consolidated LTM Adjusted EBITDA 32 12 Months Ended 12 Months Ended 12 Months Ended 12 Months Ended 12 Months Ended 12 Months Ended (in 000s) December 31, 2020 March 31, 2021 June 30, 2021 September 30, 2021 December 31, 2021 March 31, 2022 Net Income (Loss) (27,266) (24,994) (15,151) 3,587 20,246 29,412 Interest Expense 2,160 1,741 1,566 1,459 1,485 1,503 Income Tax Expense / (Benefit) (4,706) (3,085) (154) 4,555 5,253 7,601 Depreciation 7,572 7,431 7,216 7,279 7,547 7,846 Amortization 3,030 2,900 2,770 2,745 2,794 2,835 EBITDA (19,210) (16,007) (3,753) 19,625 37,325 49,197 Acquisition Costs and Other 1,019 715 709 254 1,001 1,532 Proxy Contest Costs and Recoveries 2,941 2,477 375 168 168 632 Earn-out Adjustments (1,195) (974) 897 1,203 1,871 1,748 (Gain) Loss in equity securities and other investments (171) (660) 432 363 363 - Asset Impairments 6,214 6,214 368 368 233 233 Goodwill Impairment 16,203 16,203 16,203 5,455 - - (Gain) Loss on Lease Modification (171) (171) (171) - - - Stock-based compensation 1,791 1,642 1,481 1,450 798 743 Non-cash lease expense 510 506 502 496 480 463 (Gain) Loss on Extinguishment of Debt - 223 223 223 223 - Retention expense 235 235 476 494 500 500 Restructuring and severance costs 1,076 1,076 1,553 2,364 1,345 1,345 Adjusted EBITDA 9,242 11,479 19,295 32,463 44,307 56,393
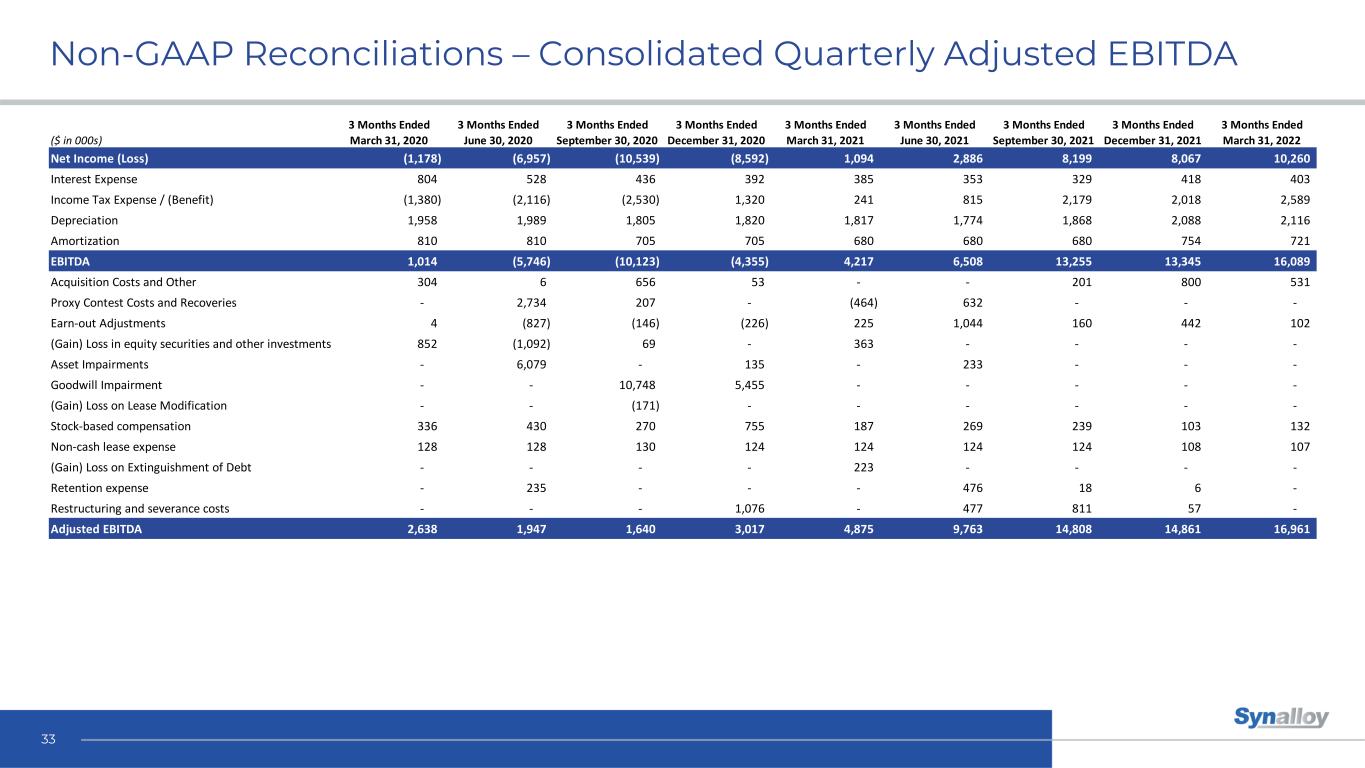
Non-GAAP Reconciliations – Consolidated Quarterly Adjusted EBITDA 33 3 Months Ended 3 Months Ended 3 Months Ended 3 Months Ended 3 Months Ended 3 Months Ended 3 Months Ended 3 Months Ended 3 Months Ended ($ in 000s) March 31, 2020 June 30, 2020 September 30, 2020 December 31, 2020 March 31, 2021 June 30, 2021 September 30, 2021 December 31, 2021 March 31, 2022 Net Income (Loss) (1,178) (6,957) (10,539) (8,592) 1,094 2,886 8,199 8,067 10,260 Interest Expense 804 528 436 392 385 353 329 418 403 Income Tax Expense / (Benefit) (1,380) (2,116) (2,530) 1,320 241 815 2,179 2,018 2,589 Depreciation 1,958 1,989 1,805 1,820 1,817 1,774 1,868 2,088 2,116 Amortization 810 810 705 705 680 680 680 754 721 EBITDA 1,014 (5,746) (10,123) (4,355) 4,217 6,508 13,255 13,345 16,089 Acquisition Costs and Other 304 6 656 53 - - 201 800 531 Proxy Contest Costs and Recoveries - 2,734 207 - (464) 632 - - - Earn-out Adjustments 4 (827) (146) (226) 225 1,044 160 442 102 (Gain) Loss in equity securities and other investments 852 (1,092) 69 - 363 - - - - Asset Impairments - 6,079 - 135 - 233 - - - Goodwill Impairment - - 10,748 5,455 - - - - - (Gain) Loss on Lease Modification - - (171) - - - - - - Stock-based compensation 336 430 270 755 187 269 239 103 132 Non-cash lease expense 128 128 130 124 124 124 124 108 107 (Gain) Loss on Extinguishment of Debt - - - - 223 - - - - Retention expense - 235 - - - 476 18 6 - Restructuring and severance costs - - - 1,076 - 477 811 57 - Adjusted EBITDA 2,638 1,947 1,640 3,017 4,875 9,763 14,808 14,861 16,961
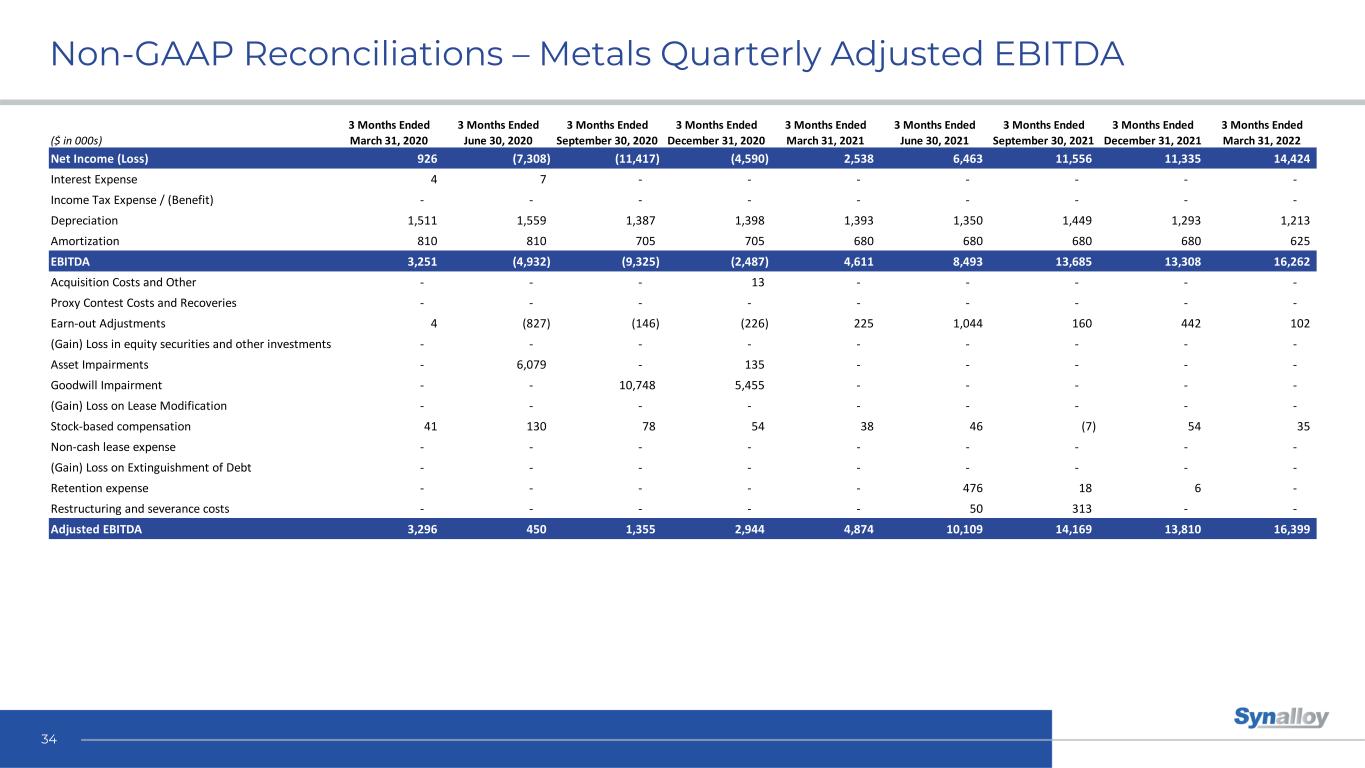
Non-GAAP Reconciliations – Metals Quarterly Adjusted EBITDA 34 3 Months Ended 3 Months Ended 3 Months Ended 3 Months Ended 3 Months Ended 3 Months Ended 3 Months Ended 3 Months Ended 3 Months Ended ($ in 000s) March 31, 2020 June 30, 2020 September 30, 2020 December 31, 2020 March 31, 2021 June 30, 2021 September 30, 2021 December 31, 2021 March 31, 2022 Net Income (Loss) 926 (7,308) (11,417) (4,590) 2,538 6,463 11,556 11,335 14,424 Interest Expense 4 7 - - - - - - - Income Tax Expense / (Benefit) - - - - - - - - - Depreciation 1,511 1,559 1,387 1,398 1,393 1,350 1,449 1,293 1,213 Amortization 810 810 705 705 680 680 680 680 625 EBITDA 3,251 (4,932) (9,325) (2,487) 4,611 8,493 13,685 13,308 16,262 Acquisition Costs and Other - - - 13 - - - - - Proxy Contest Costs and Recoveries - - - - - - - - - Earn-out Adjustments 4 (827) (146) (226) 225 1,044 160 442 102 (Gain) Loss in equity securities and other investments - - - - - - - - - Asset Impairments - 6,079 - 135 - - - - - Goodwill Impairment - - 10,748 5,455 - - - - - (Gain) Loss on Lease Modification - - - - - - - - - Stock-based compensation 41 130 78 54 38 46 (7) 54 35 Non-cash lease expense - - - - - - - - - (Gain) Loss on Extinguishment of Debt - - - - - - - - - Retention expense - - - - - 476 18 6 - Restructuring and severance costs - - - - - 50 313 - - Adjusted EBITDA 3,296 450 1,355 2,944 4,874 10,109 14,169 13,810 16,399
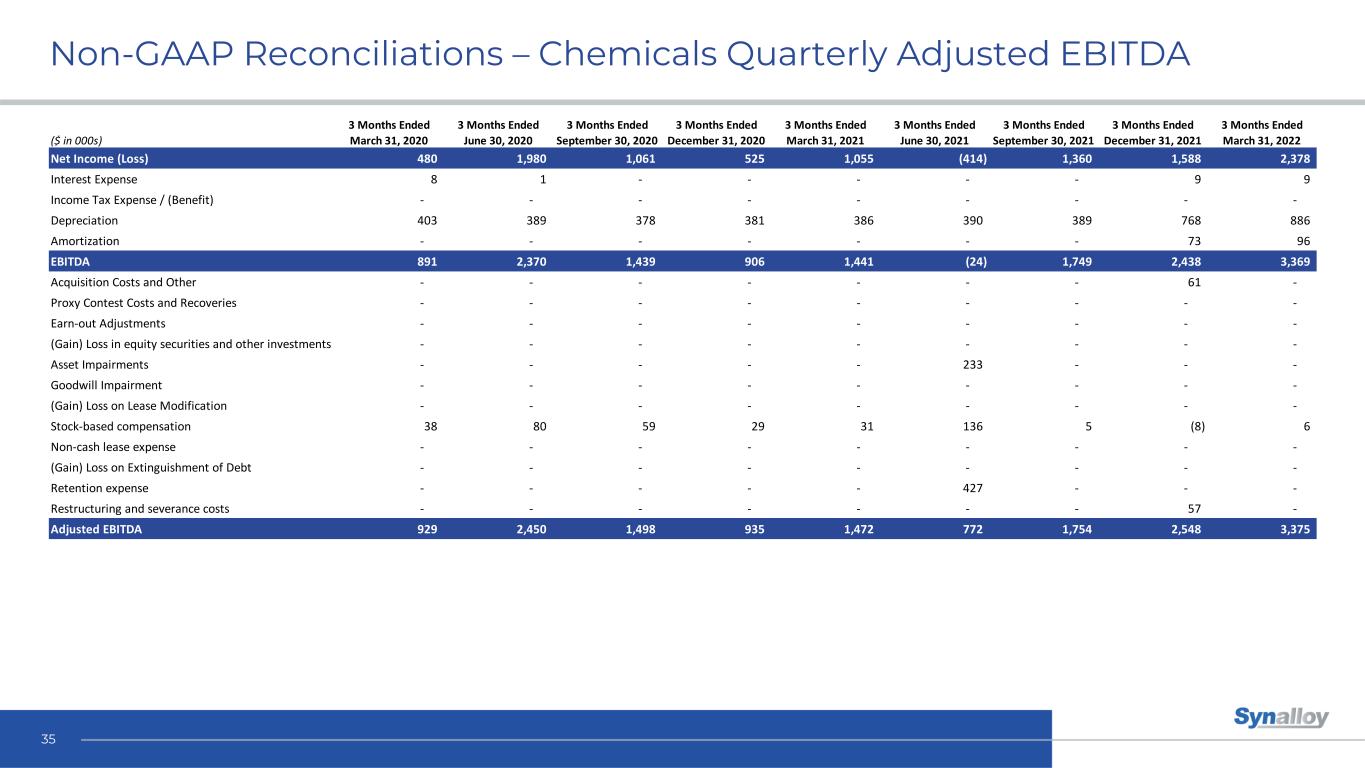
Non-GAAP Reconciliations – Chemicals Quarterly Adjusted EBITDA 35 3 Months Ended 3 Months Ended 3 Months Ended 3 Months Ended 3 Months Ended 3 Months Ended 3 Months Ended 3 Months Ended 3 Months Ended ($ in 000s) March 31, 2020 June 30, 2020 September 30, 2020 December 31, 2020 March 31, 2021 June 30, 2021 September 30, 2021 December 31, 2021 March 31, 2022 Net Income (Loss) 480 1,980 1,061 525 1,055 (414) 1,360 1,588 2,378 Interest Expense 8 1 - - - - - 9 9 Income Tax Expense / (Benefit) - - - - - - - - - Depreciation 403 389 378 381 386 390 389 768 886 Amortization - - - - - - - 73 96 EBITDA 891 2,370 1,439 906 1,441 (24) 1,749 2,438 3,369 Acquisition Costs and Other - - - - - - - 61 - Proxy Contest Costs and Recoveries - - - - - - - - - Earn-out Adjustments - - - - - - - - - (Gain) Loss in equity securities and other investments - - - - - - - - - Asset Impairments - - - - - 233 - - - Goodwill Impairment - - - - - - - - - (Gain) Loss on Lease Modification - - - - - - - - - Stock-based compensation 38 80 59 29 31 136 5 (8) 6 Non-cash lease expense - - - - - - - - - (Gain) Loss on Extinguishment of Debt - - - - - - - - - Retention expense - - - - - 427 - - - Restructuring and severance costs - - - - - - - 57 - Adjusted EBITDA 929 2,450 1,498 935 1,472 772 1,754 2,548 3,375
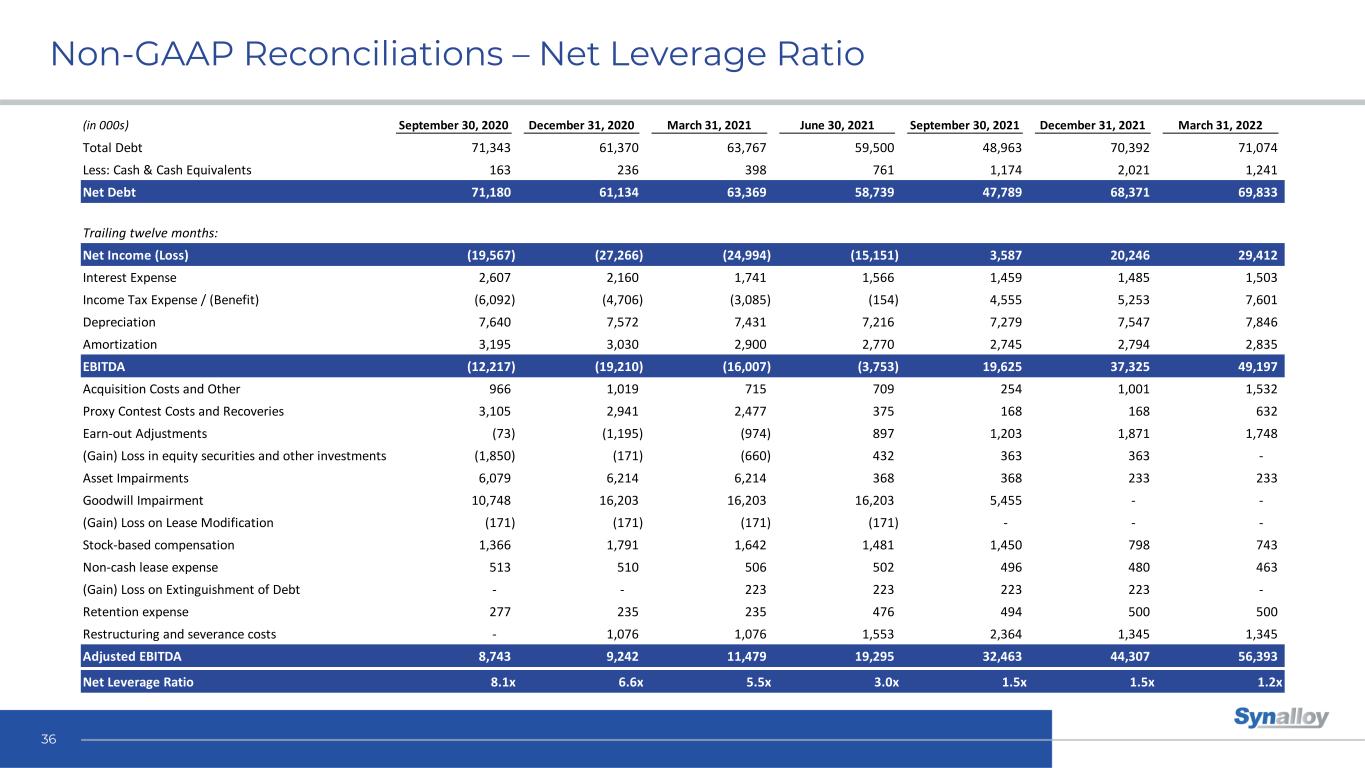
Non-GAAP Reconciliations – Net Leverage Ratio 36 (in 000s) September 30, 2020 December 31, 2020 March 31, 2021 June 30, 2021 September 30, 2021 December 31, 2021 March 31, 2022 Total Debt 71,343 61,370 63,767 59,500 48,963 70,392 71,074 Less: Cash & Cash Equivalents 163 236 398 761 1,174 2,021 1,241 Net Debt 71,180 61,134 63,369 58,739 47,789 68,371 69,833 Trailing twelve months: Net Income (Loss) (19,567) (27,266) (24,994) (15,151) 3,587 20,246 29,412 Interest Expense 2,607 2,160 1,741 1,566 1,459 1,485 1,503 Income Tax Expense / (Benefit) (6,092) (4,706) (3,085) (154) 4,555 5,253 7,601 Depreciation 7,640 7,572 7,431 7,216 7,279 7,547 7,846 Amortization 3,195 3,030 2,900 2,770 2,745 2,794 2,835 EBITDA (12,217) (19,210) (16,007) (3,753) 19,625 37,325 49,197 Acquisition Costs and Other 966 1,019 715 709 254 1,001 1,532 Proxy Contest Costs and Recoveries 3,105 2,941 2,477 375 168 168 632 Earn-out Adjustments (73) (1,195) (974) 897 1,203 1,871 1,748 (Gain) Loss in equity securities and other investments (1,850) (171) (660) 432 363 363 - Asset Impairments 6,079 6,214 6,214 368 368 233 233 Goodwill Impairment 10,748 16,203 16,203 16,203 5,455 - - (Gain) Loss on Lease Modification (171) (171) (171) (171) - - - Stock-based compensation 1,366 1,791 1,642 1,481 1,450 798 743 Non-cash lease expense 513 510 506 502 496 480 463 (Gain) Loss on Extinguishment of Debt - - 223 223 223 223 - Retention expense 277 235 235 476 494 500 500 Restructuring and severance costs - 1,076 1,076 1,553 2,364 1,345 1,345 Adjusted EBITDA 8,743 9,242 11,479 19,295 32,463 44,307 56,393 Net Leverage Ratio 8.1x 6.6x 5.5x 3.0x 1.5x 1.5x 1.2x