Planet Microcap Showcase Ascent Industr ies Co. | Nasdaq: ACNT
Forward-Looking Statements This presentation includes "forward-looking statements" within the meaning of the Private Securities Litigation Reform Act of 1995 and other applicable federal securities laws. All statements that are not historical facts are forward-looking statements. Forward looking statements can be identified through the use of words such as "estimate," "project," "intend," "expect," "believe," "should," "anticipate," "hope," "optimistic," "plan," "outlook," "should," "could," "may" and similar expressions. The forward-looking statements are subject to certain risks and uncertainties, including without limitation those identified below, which could cause actual results to differ materially from historical results or those anticipated. Readers are cautioned not to place undue reliance on these forward-looking statements. The following factors could cause actual results to differ materially from historical results or those anticipated: adverse economic conditions, including risks relating to the impact and spread of and the government’s response to pandemics; inability to weather an economic downturn; the impact of competitive products and pricing; product demand and acceptance risks; raw material and other increased costs, including the impact of tariffs; raw material availability; financial stability of the Company’s customers; customer delays or difficulties in the production of products; loss of consumer or investor confidence; employee relations; ability to maintain workforce by hiring trained employees; labor efficiencies; risks associated with acquisitions; environmental issues; negative or unexpected results from tax law changes; inability to comply with covenants and ratios required by the Company’s debt financing arrangements; and other risks detailed from time-to-time in Ascent Industries Co.'s Securities and Exchange Commission filings, including our Annual Report on Form 10-K, which filings are available from the SEC. Ascent Industries Co. assumes no obligation to update any forward-looking information included in this release. Non-GAAP Financial Information Financial statement information included in this earnings release includes non-GAAP (Generally Accepted Accounting Principles) measures and should be read along with the accompanying tables which provide a reconciliation of non-GAAP measures to GAAP measures. Adjusted EBITDA is a non-GAAP financial measure that the Company believes is useful to investors in evaluating its results to determine the value of a company. An item is excluded in the measure if its periodic value is inconsistent and sufficiently material that not identifying the item would render period comparability less meaningful to the reader or if including the item provides a clearer representation of normalized periodic earnings. The Company excludes in Adjusted EBITDA two categories of items: 1) Base EBITDA components, including: interest expense, income taxes, depreciation and amortization, and 2) Material transaction costs including: goodwill impairment, asset impairment, gain on lease modification, stock-based compensation, non-cash lease cost, acquisition costs and other fees, shelf registration costs, loss on extinguishment of debt, retention costs and restructuring & severance costs from net income. Management believes that these non-GAAP measures are useful because they are key measures used by our management team to evaluate our operating performance, generate future operating plans and make strategic decisions as well as allow readers to compare the financial results between periods. Non-GAAP measures should not be considered as an alternative to any measure of performance or financial condition as promulgated under GAAP, and investors should consider the Company's performance and financial condition as reported under GAAP and all other relevant information when assessing the performance or financial condition of the Company. Non-GAAP measures have limitations as analytical tools, and investors should not consider them in isolation or as a substitute for analysis of the Company's results or financial condition as reported under GAAP. Forward Looking Statement Safe Harbor and Non-GAAP Information 2
2025 The Final Inning of a Successful Transformation
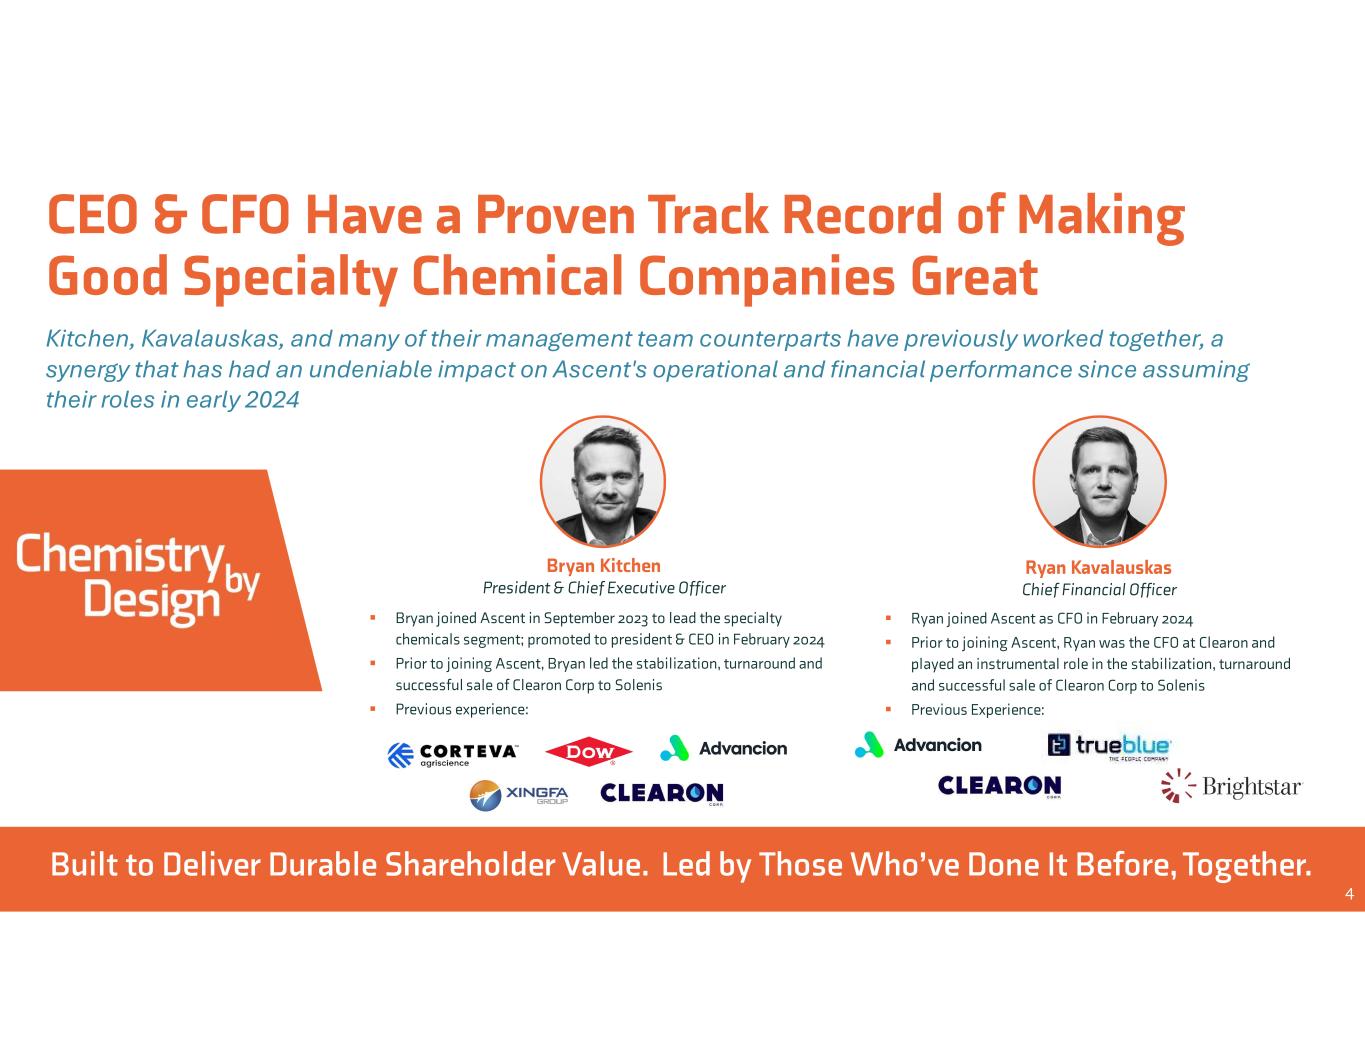
Within an asset base capable of supporting significant growth with minimal capital reinvestment 3. Validated by Results. Engineered to Scale. Led by Proven Operators. Kitchen, Kavalauskas, and many of their management team counterparts have previously worked together, a synergy that has had an undeniable impact on Ascent's operational and financial performance since assuming their roles in early 2024 CEO & CFO Have a Proven Track Record of Making Good Specialty Chemical Companies Great Bryan Kitchen President & Chief Executive Officer Bryan joined Ascent in September 2023 to lead the specialty chemicals segment; promoted to president & CEO in February 2024 Prior to joining Ascent, Bryan led the stabilization, turnaround and successful sale of Clearon Corp to Solenis Previous experience: Ryan Kavalauskas Chief Financial Officer Ryan joined Ascent as CFO in February 2024 Prior to joining Ascent, Ryan was the CFO at Clearon and played an instrumental role in the stabilization, turnaround and successful sale of Clearon Corp to Solenis Previous Experience: Built to Deliver Durable Shareholder Value. Led by Those Who’ve Done It Before, Together. 4
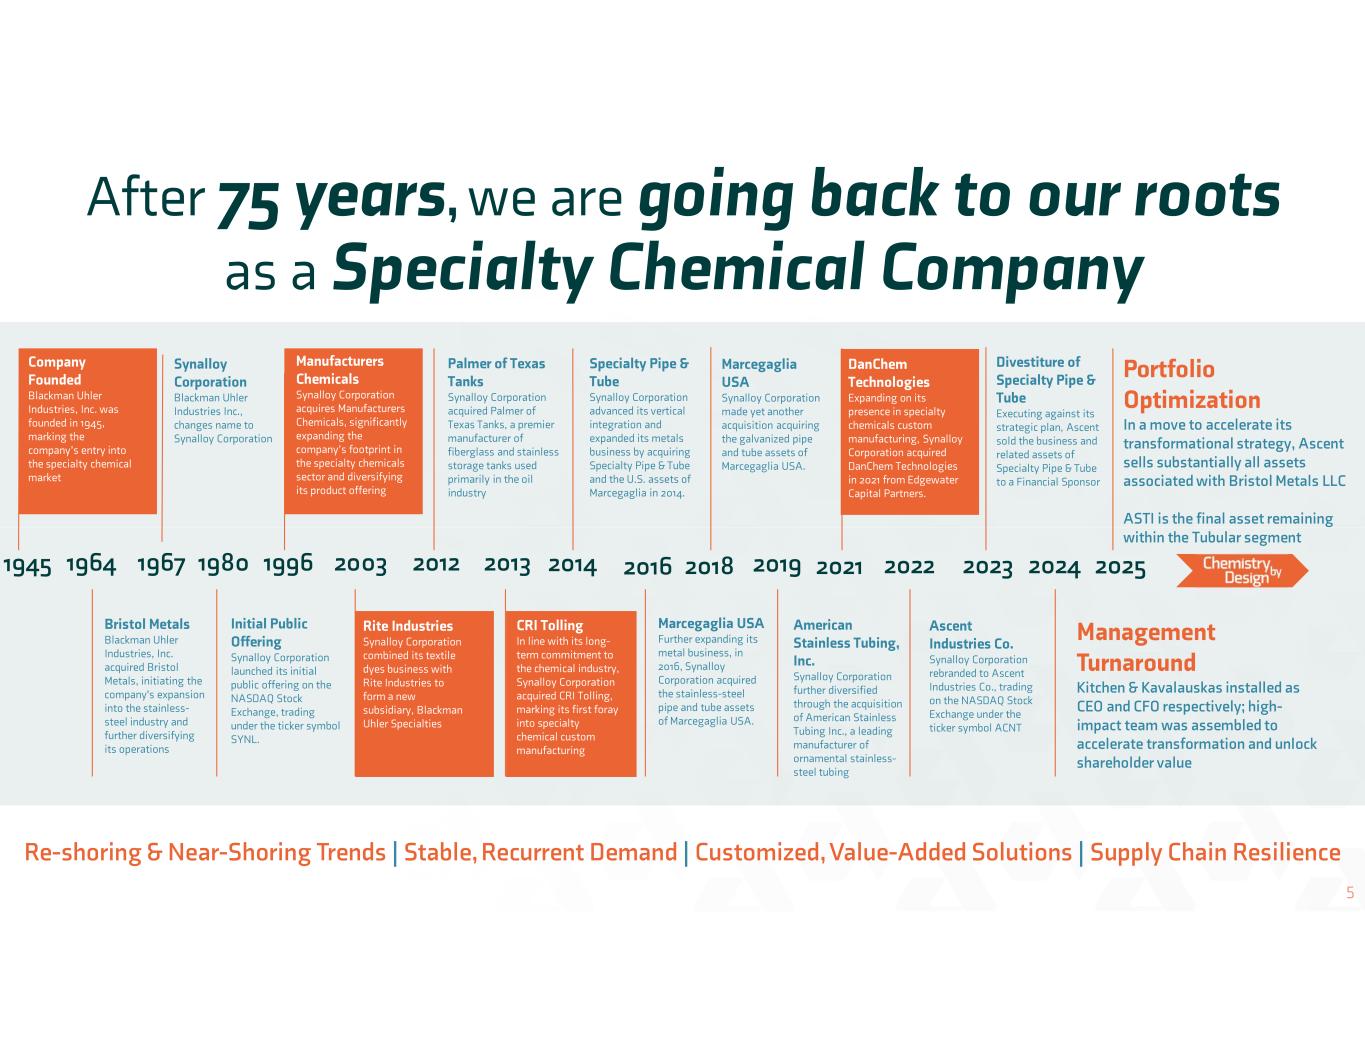
After 75 years, we are going back to our roots as a Specialty Chemical Company Company Founded Blackman Uhler Industries, Inc. was founded in 1945, marking the company’s entry into the specialty chemical market Bristol Metals Blackman Uhler Industries, Inc. acquired Bristol Metals, initiating the company's expansion into the stainless- steel industry and further diversifying its operations Synalloy Corporation Blackman Uhler Industries Inc., changes name to Synalloy Corporation Initial Public Offering Synalloy Corporation launched its initial public offering on the NASDAQ Stock Exchange, trading under the ticker symbol SYNL. Manufacturers Chemicals Synalloy Corporation acquires Manufacturers Chemicals, significantly expanding the company’s footprint in the specialty chemicals sector and diversifying its product offering Rite Industries Synalloy Corporation combined its textile dyes business with Rite Industries to form a new subsidiary, Blackman Uhler Specialties Palmer of Texas Tanks Synalloy Corporation acquired Palmer of Texas Tanks, a premier manufacturer of fiberglass and stainless storage tanks used primarily in the oil industry CRI Tolling In line with its long- term commitment to the chemical industry, Synalloy Corporation acquired CRI Tolling, marking its first foray into specialty chemical custom manufacturing Specialty Pipe & Tube Synalloy Corporation advanced its vertical integration and expanded its metals business by acquiring Specialty Pipe & Tube and the U.S. assets of Marcegaglia in 2014. Marcegaglia USA Further expanding its metal business, in 2016, Synalloy Corporation acquired the stainless-steel pipe and tube assets of Marcegaglia USA. Marcegaglia USA Synalloy Corporation made yet another acquisition acquiring the galvanized pipe and tube assets of Marcegaglia USA. American Stainless Tubing, Inc. Synalloy Corporation further diversified through the acquisition of American Stainless Tubing Inc., a leading manufacturer of ornamental stainless- steel tubing DanChem Technologies Expanding on its presence in specialty chemicals custom manufacturing, Synalloy Corporation acquired DanChem Technologies in 2021 from Edgewater Capital Partners. Ascent Industries Co. Synalloy Corporation rebranded to Ascent Industries Co., trading on the NASDAQ Stock Exchange under the ticker symbol ACNT Divestiture of Specialty Pipe & Tube Executing against its strategic plan, Ascent sold the business and related assets of Specialty Pipe & Tube to a Financial Sponsor Portfolio Optimization In a move to accelerate its transformational strategy, Ascent sells substantially all assets associated with Bristol Metals LLC ASTI is the final asset remaining within the Tubular segment 1945 1964 1967 1980 1996 2003 2012 2013 2014 2016 2018 2019 2021 2022 2023 2025 Re-shoring & Near-Shoring Trends | Stable, Recurrent Demand | Customized, Value-Added Solutions | Supply Chain Resilience 5 2024 Management Turnaround Kitchen & Kavalauskas installed as CEO and CFO respectively; high- impact team was assembled to accelerate transformation and unlock shareholder value
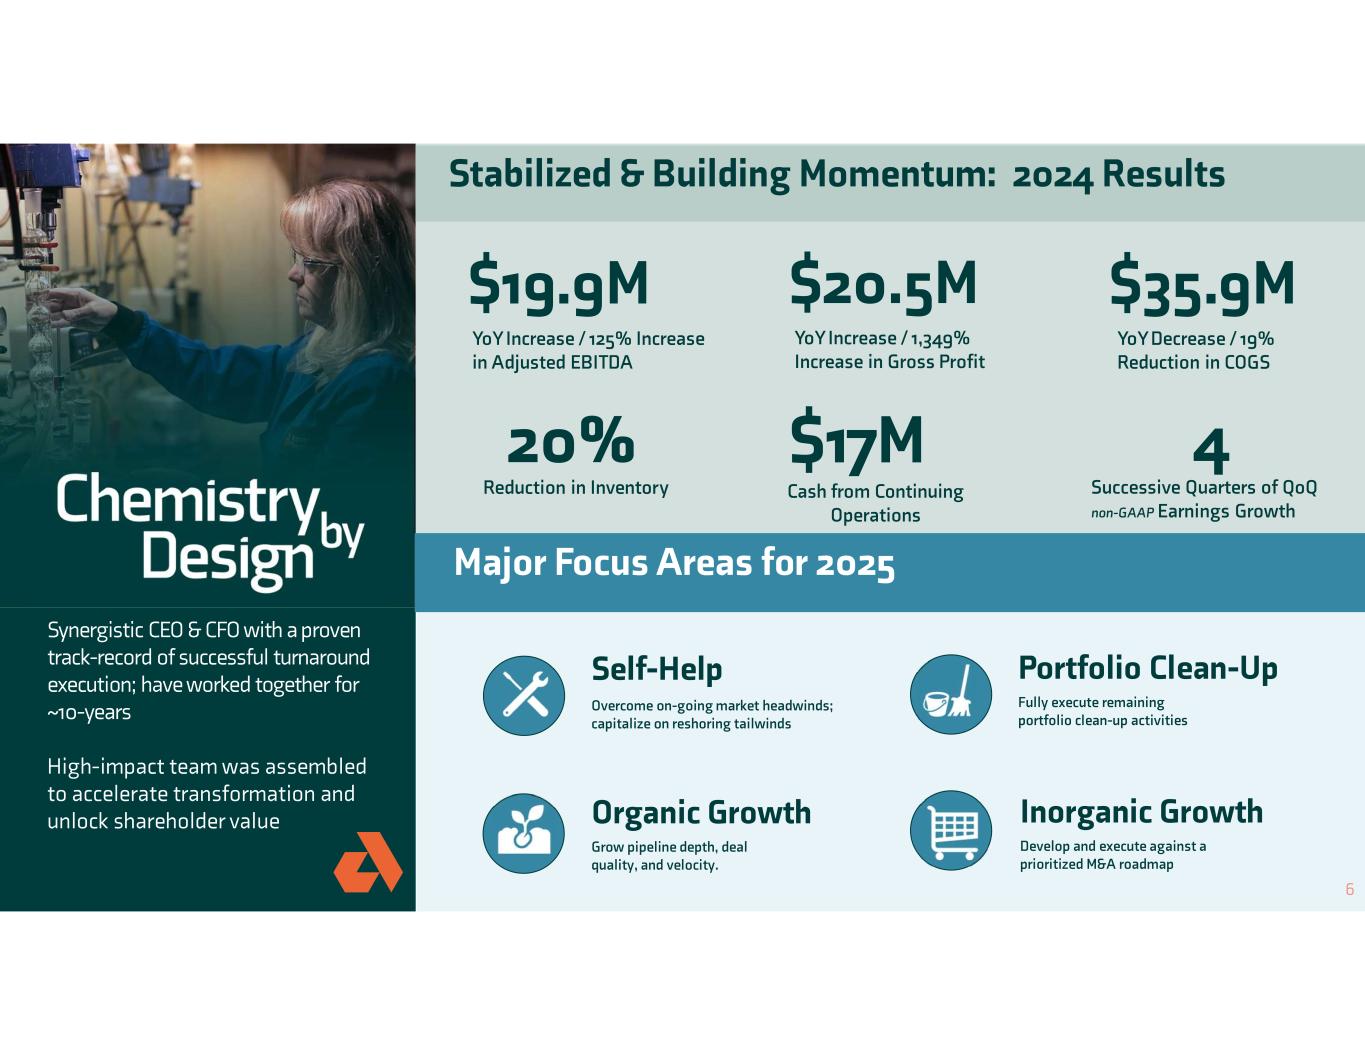
4 Successive Quarters of QoQ non-GAAP Earnings Growth $19.9M YoY Increase / 125% Increase in Adjusted EBITDA $35.9M YoY Decrease / 19% Reduction in COGS $20.5M YoY Increase / 1,349% Increase in Gross Profit $17M Cash from Continuing Operations 20% Reduction in Inventory Self-Help Overcome on-going market headwinds; capitalize on reshoring tailwinds Portfolio Clean-Up Fully execute remaining portfolio clean-up activities Organic Growth Grow pipeline depth, deal quality, and velocity. Inorganic Growth Develop and execute against a prioritized M&A roadmap Synergistic CEO & CFO with a proven track-record of successful turnaround execution; have worked together for ~10-years High-impact team was assembled to accelerate transformation and unlock shareholder value Stabilized & Building Momentum: 2024 Results Major Focus Areas for 2025 6
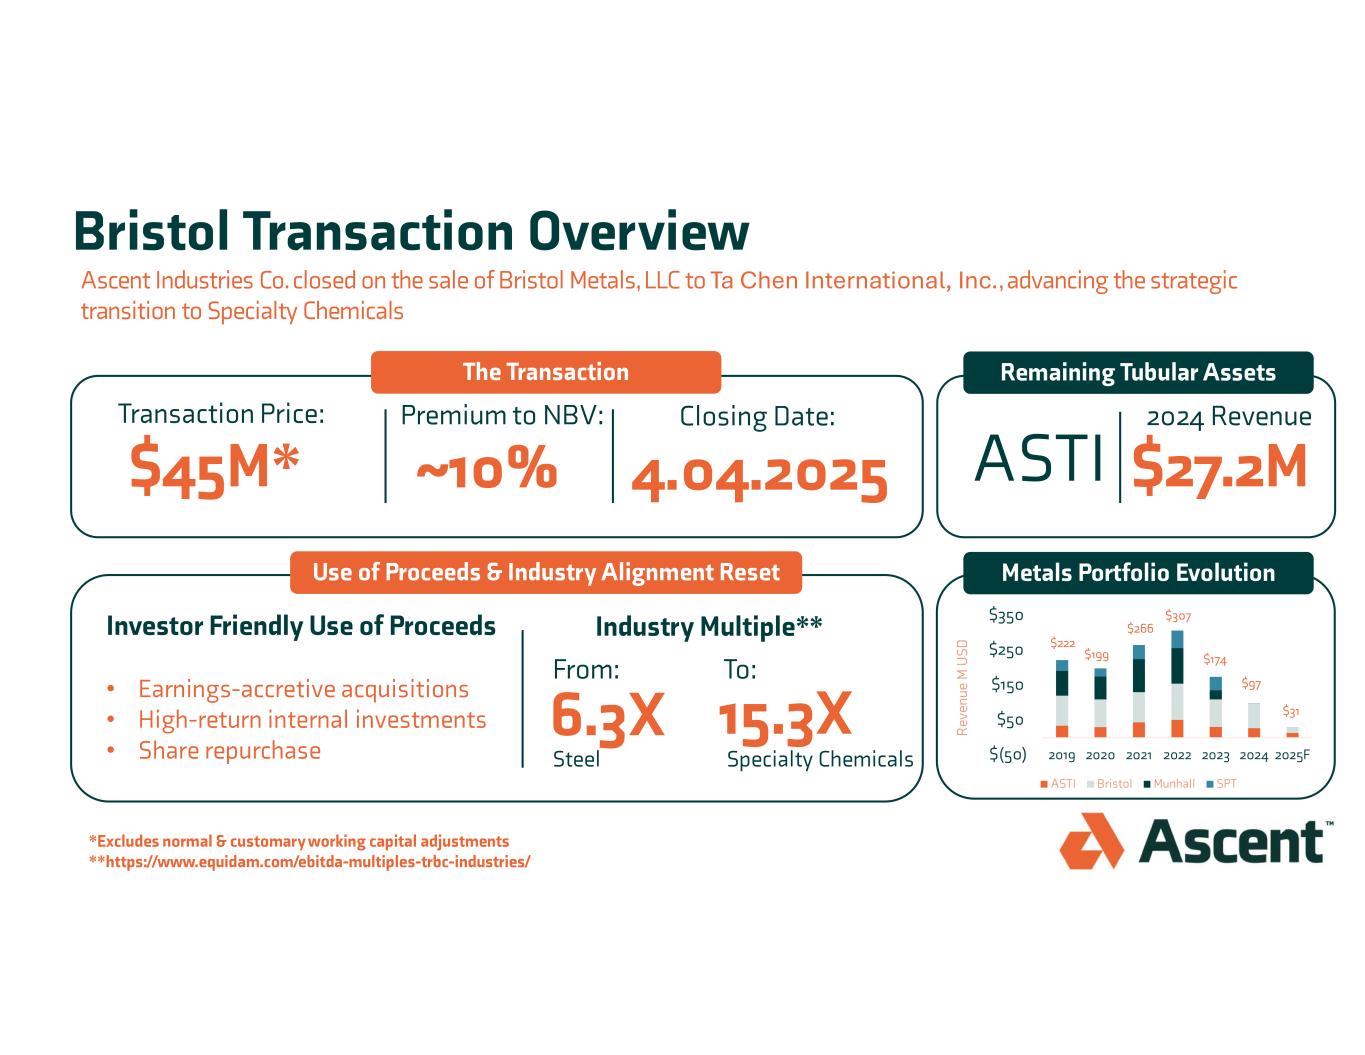
Bristol Transaction Overview Ascent Industries Co. closed on the sale of Bristol Metals, LLC to Ta Chen International, Inc., advancing the strategic transition to Specialty Chemicals Transaction Price: $45M* Closing Date: 4.04.2025 Investor Friendly Use of Proceeds • Earnings-accretive acquisitions • High-return internal investments • Share repurchase $27.2M 2024 Revenue Industry Multiple** From: 6.3X ASTI To: 15.3X Steel Specialty Chemicals Premium to NBV: ~10% $(50) $50 $150 $250 $350 2019 2020 2021 2022 2023 2024 2025F R ev en ue M U SD ASTI Bristol Munhall SPT Remaining Tubular Assets Metals Portfolio Evolution The Transaction Use of Proceeds & Industry Alignment Reset $222 $199 $266 $307 $174 $97 $31 *Excludes normal & customary working capital adjustments **https://www.equidam.com/ebitda-multiples-trbc-industries/
2025 Chemistry by Design Ascent Today
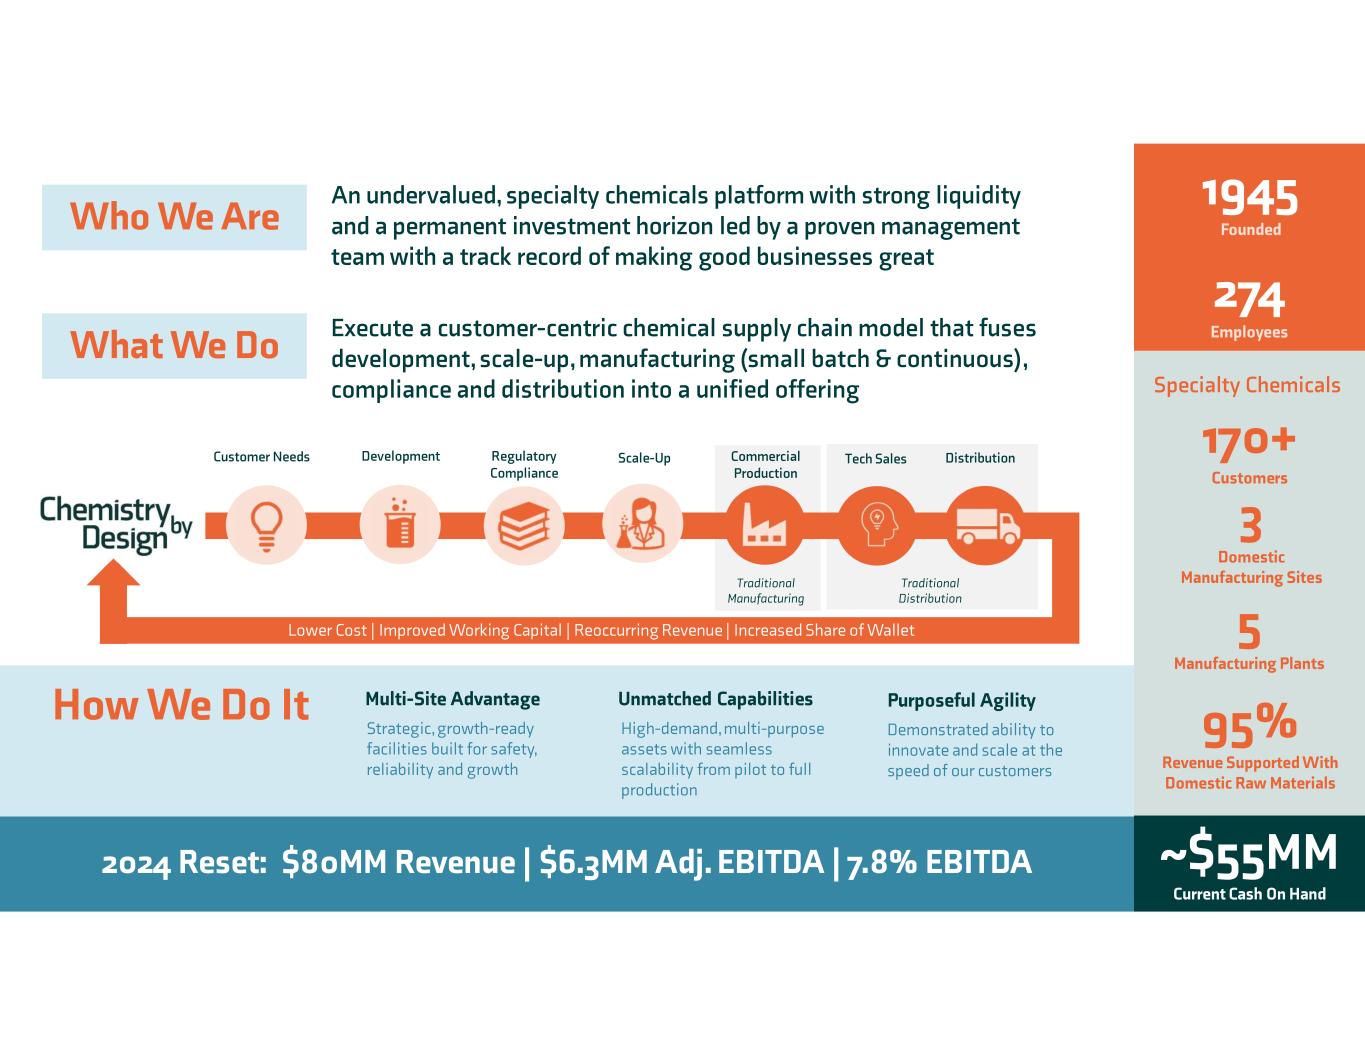
Who We Are An undervalued, specialty chemicals platform with strong liquidity and a permanent investment horizon led by a proven management team with a track record of making good businesses great Execute a customer-centric chemical supply chain model that fuses development, scale-up, manufacturing (small batch & continuous), compliance and distribution into a unified offering 2024 Reset: $80MM Revenue | $6.3MM Adj. EBITDA | 7.8% EBITDA Multi-Site Advantage Unmatched Capabilities Purposeful Agility Strategic, growth-ready facilities built for safety, reliability and growth High-demand, multi-purpose assets with seamless scalability from pilot to full production Demonstrated ability to innovate and scale at the speed of our customers 1945 Founded 274 Employees 170+ Customers 3 Domestic Manufacturing Sites 5 Manufacturing Plants 95% Revenue Supported With Domestic Raw Materials Customer Needs Regulatory Compliance Scale-Up Commercial Production Tech Sales Distribution How We Do It Traditional Manufacturing Traditional Distribution Development ~$55MM Current Cash On Hand Lower Cost | Improved Working Capital | Reoccurring Revenue | Increased Share of Wallet What We Do Specialty Chemicals
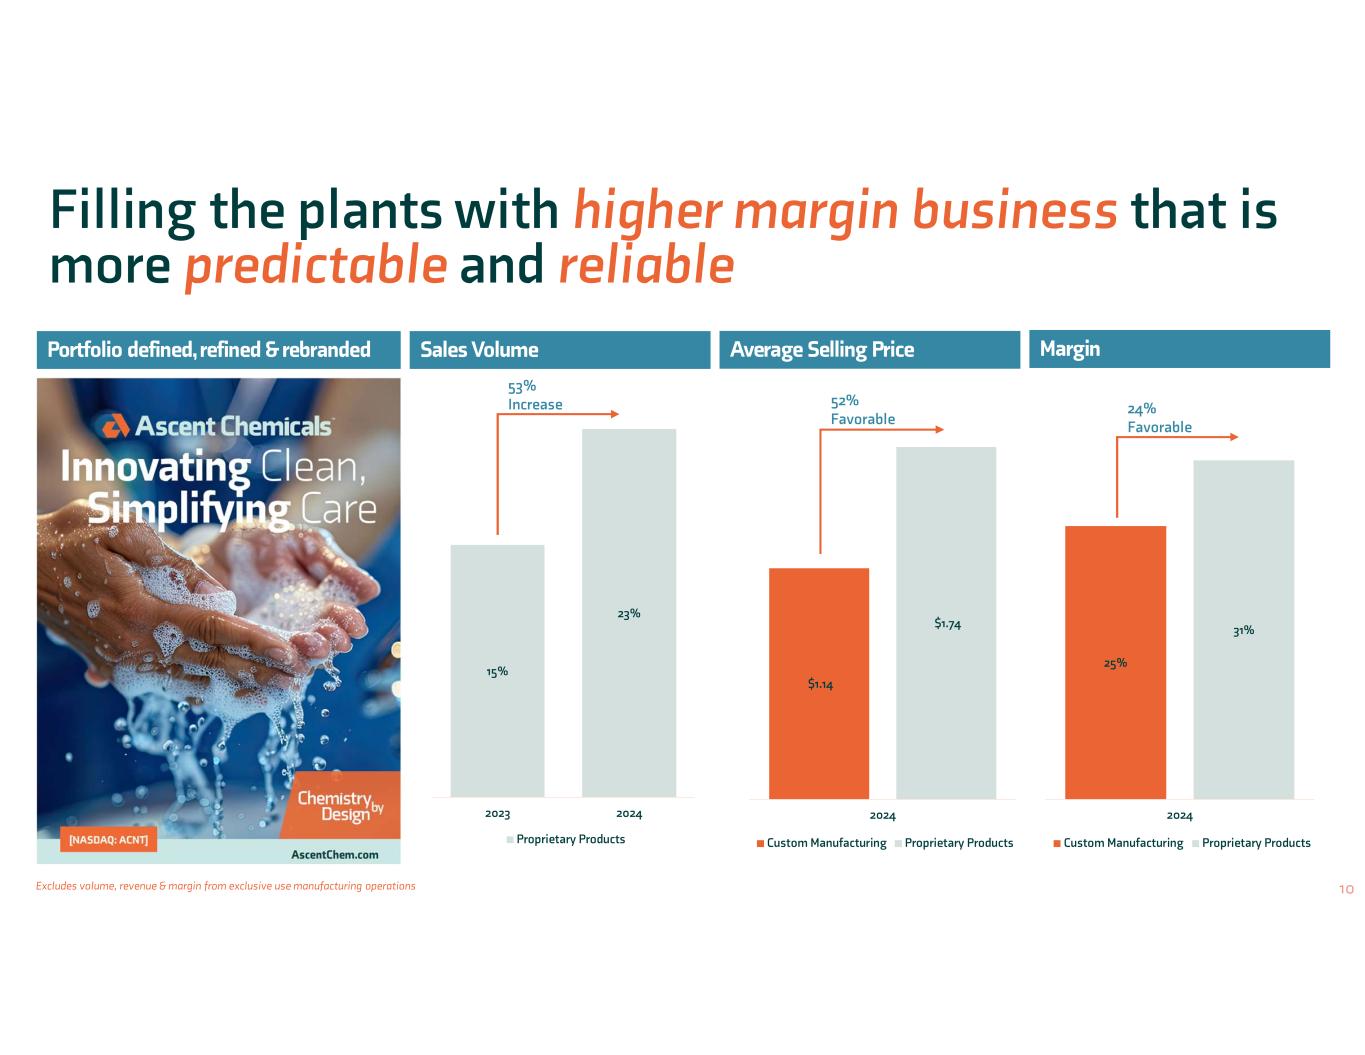
$1.14 $1.74 2024 Custom Manufacturing Proprietary Products Filling the plants with higher margin business that is more predictable and reliable Portfolio defined, refined & rebranded Excludes volume, revenue & margin from exclusive use manufacturing operations Sales Volume Average Selling Price Margin 10 15% 23% 2023 2024 Proprietary Products 53% Increase 52% Favorable 25% 31% 2024 Custom Manufacturing Proprietary Products 24% Favorable
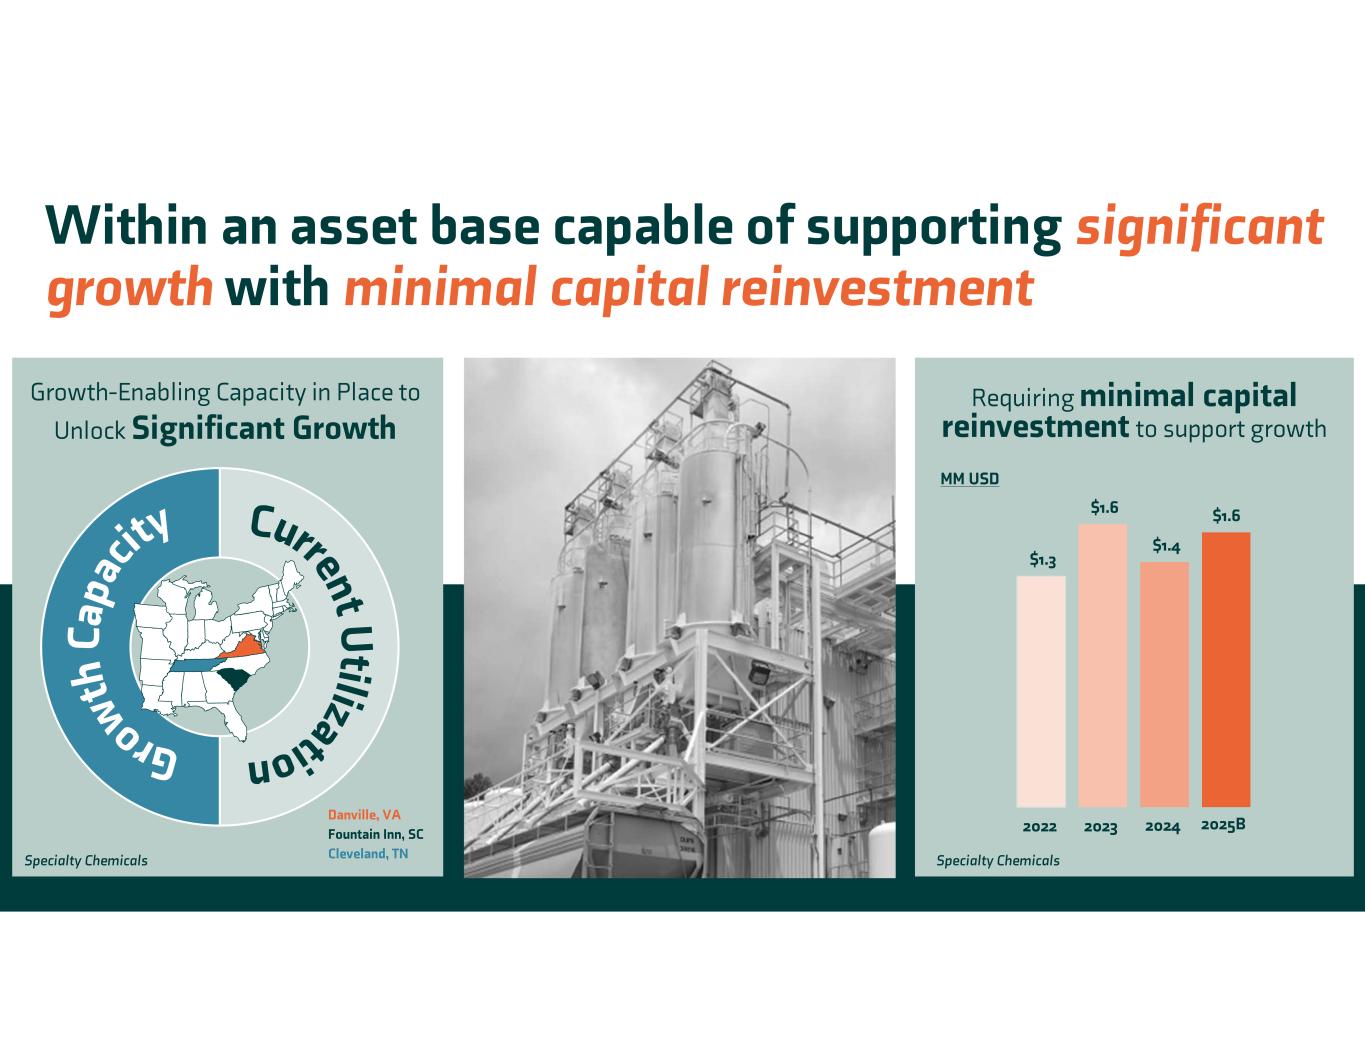
Growth-Enabling Capacity in Place to Unlock Significant Growth Requiring minimal capital reinvestment to support growth $1.3 $1.6 $1.4 $1.6 2022 2023 2024 Danville, VA Fountain Inn, SC Cleveland, TN MM USD Specialty Chemicals 2025B Specialty Chemicals Within an asset base capable of supporting significant growth with minimal capital reinvestment
2025-2030 Durable Earnings-Growth Growth Levers
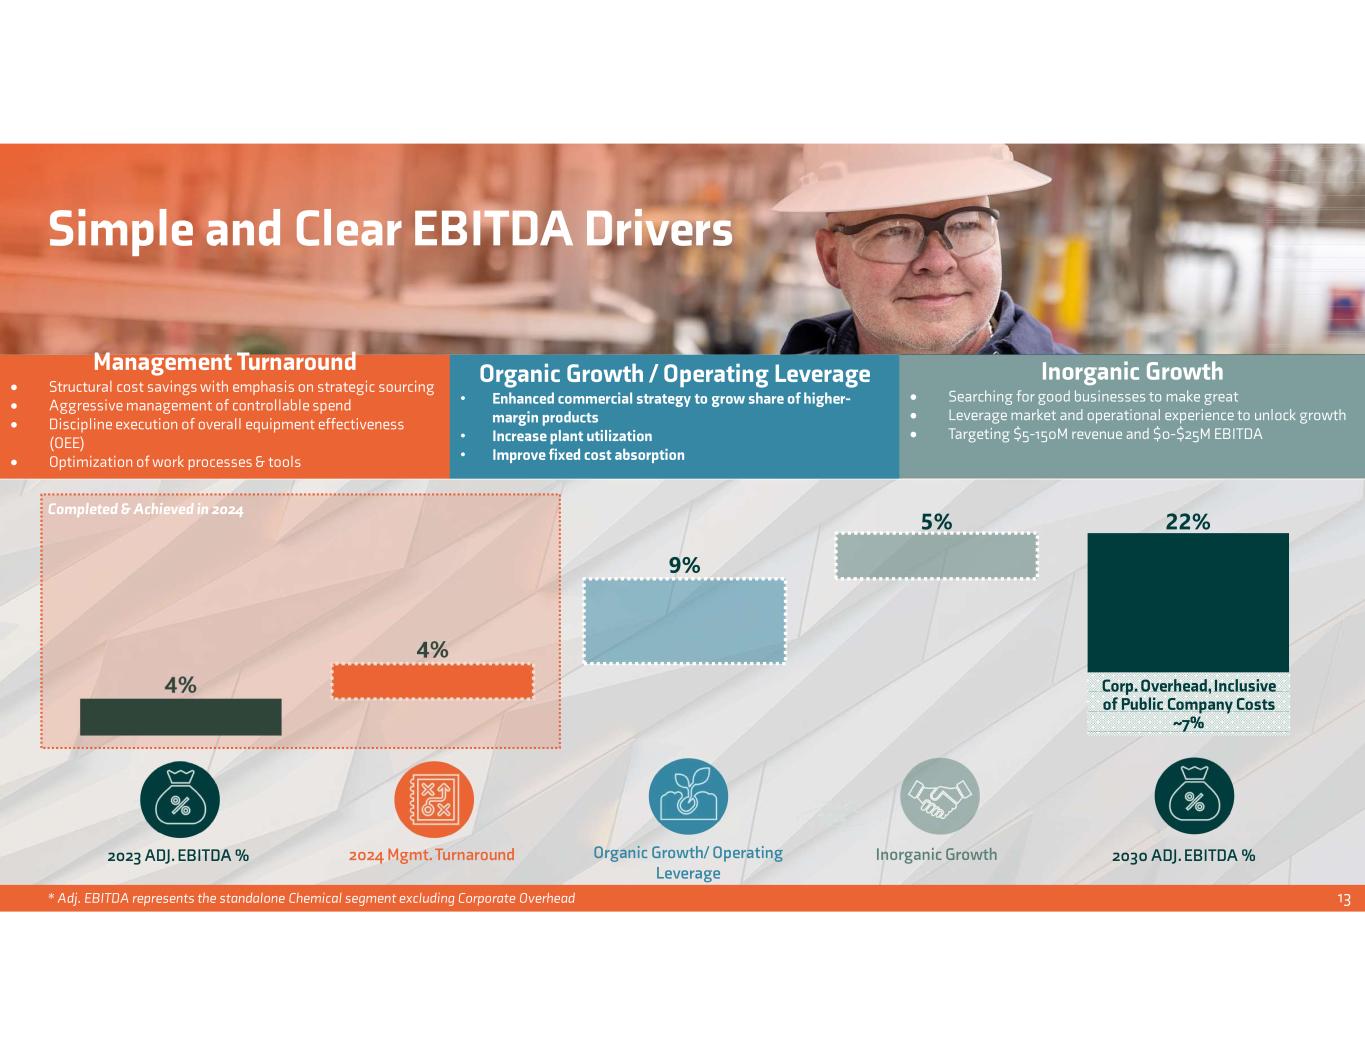
Simple and Clear EBITDA Drivers Management Turnaround Structural cost savings with emphasis on strategic sourcing Aggressive management of controllable spend Discipline execution of overall equipment effectiveness (OEE) Optimization of work processes & tools Organic Growth / Operating Leverage • Enhanced commercial strategy to grow share of higher- margin products • Increase plant utilization • Improve fixed cost absorption Inorganic Growth Searching for good businesses to make great Leverage market and operational experience to unlock growth Targeting $5-150M revenue and $0-$25M EBITDA 4% 4% 9% 5% 22% * Adj. EBITDA represents the standalone Chemical segment excluding Corporate Overhead 2023 ADJ. EBITDA % 2030 ADJ. EBITDA %2024 Mgmt. Turnaround Organic Growth/ Operating Leverage Inorganic Growth Corp. Overhead, Inclusive of Public Company Costs ~7% 13 Completed & Achieved in 2024
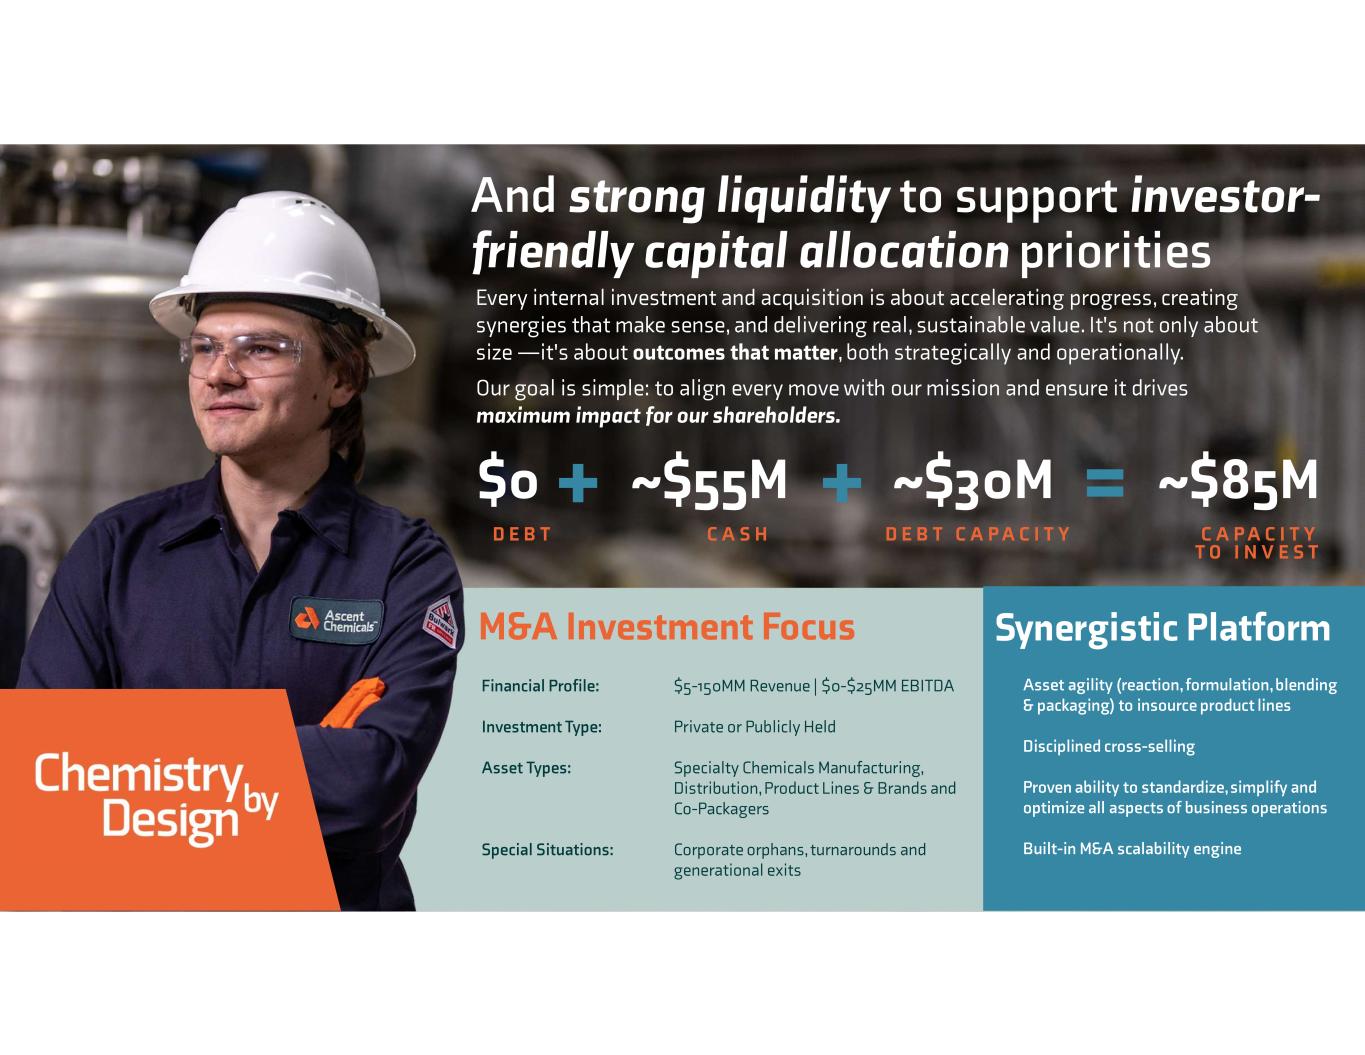
And strong liquidity to support investor- friendly capital allocation priorities Every internal investment and acquisition is about accelerating progress, creating synergies that make sense, and delivering real, sustainable value. It's not only about size —it's about outcomes that matter, both strategically and operationally. Our goal is simple: to align every move with our mission and ensure it drives maximum impact for our shareholders. Financial Profile: $5-150MM Revenue | $0-$25MM EBITDA Investment Type: Private or Publicly Held Asset Types: Specialty Chemicals Manufacturing, Distribution, Product Lines & Brands and Co-Packagers Special Situations: Corporate orphans, turnarounds and generational exits M&A Investment Focus $0 ~$55M D E B T C A P A C I T Y ~$30M C A P A C I T Y T O I N V E S T ~$85M+ + = D E B T C A S H 14 Synergistic Platform Asset agility (reaction, formulation, blending & packaging) to insource product lines Disciplined cross-selling Proven ability to standardize, simplify and optimize all aspects of business operations Built-in M&A scalability engine
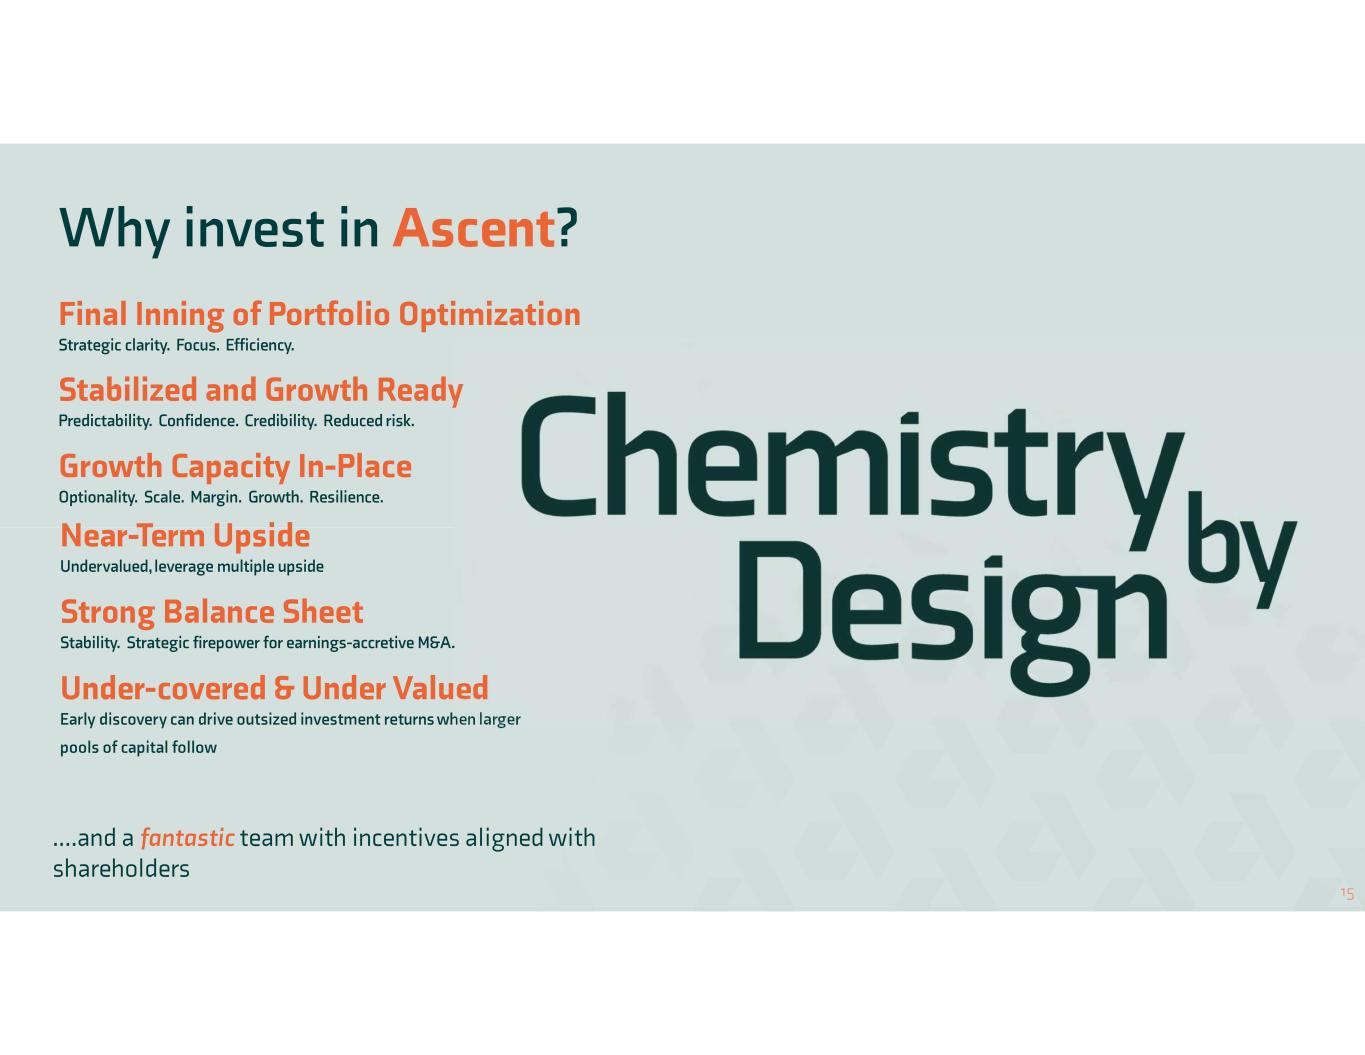
Final Inning of Portfolio Optimization Strategic clarity. Focus. Efficiency. Stabilized and Growth Ready Predictability. Confidence. Credibility. Reduced risk. Growth Capacity In-Place Optionality. Scale. Margin. Growth. Resilience. Near-Term Upside Undervalued, leverage multiple upside Strong Balance Sheet Stability. Strategic firepower for earnings-accretive M&A. Under-covered & Under Valued Early discovery can drive outsized investment returns when larger pools of capital follow Why invest in Ascent? ….and a fantastic team with incentives aligned with shareholders 15
Ryan Kavalauskas Chief Financial Officer rkavalauskas@ascentco.com Contact Us 16 Ralf Esper Gateway Group, Inc. ACNT@gateway-grp.com
Appendix 17
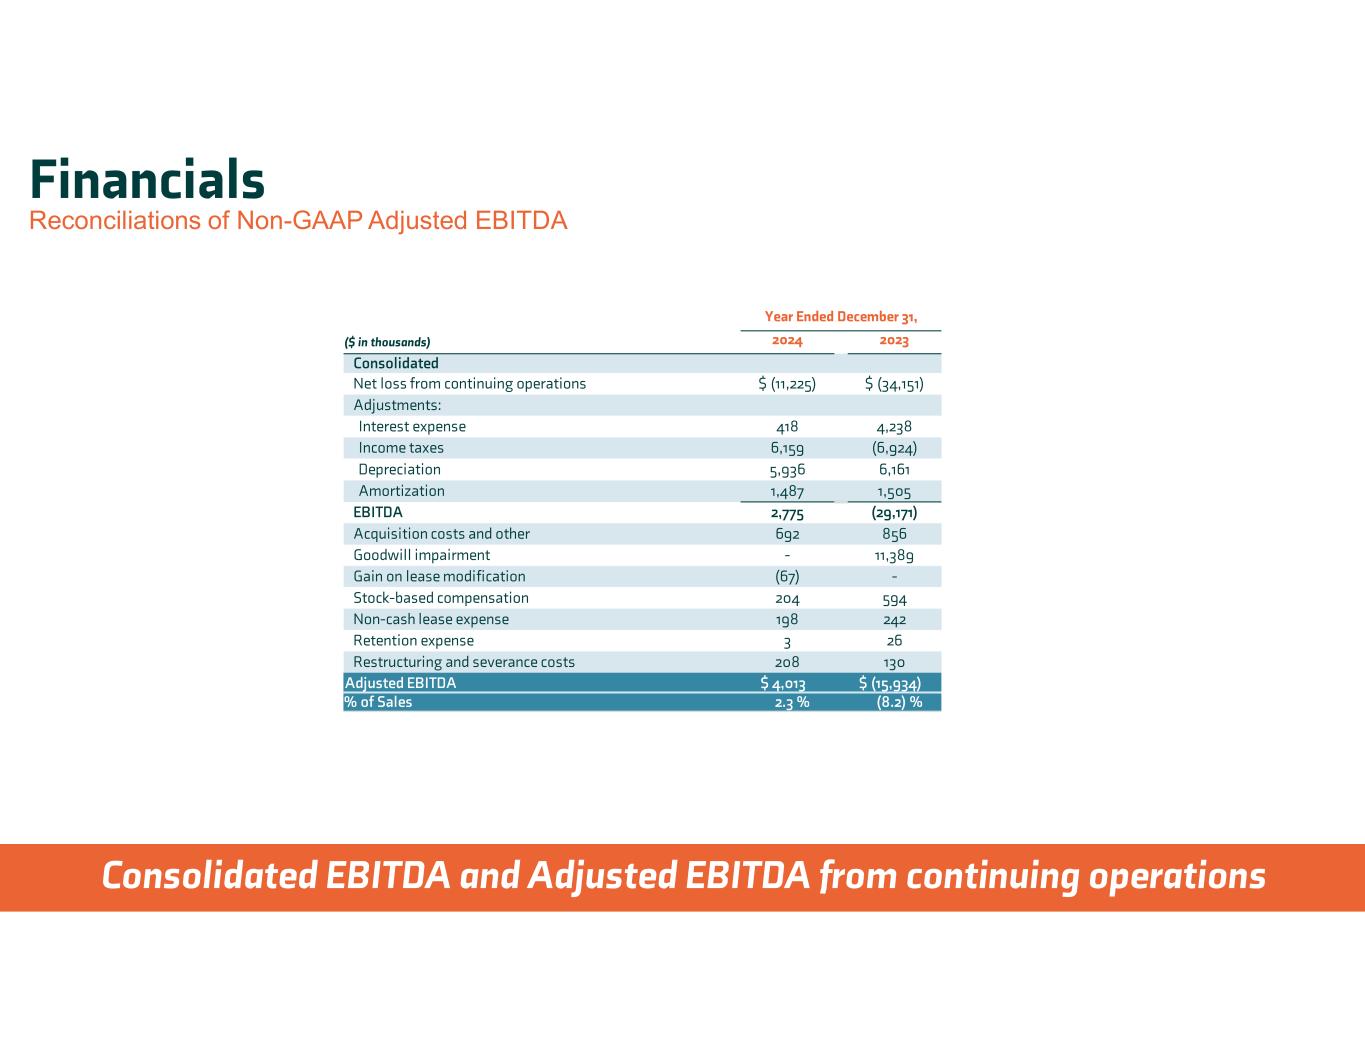
Financials Consolidated EBITDA and Adjusted EBITDA from continuing operations Year Ended December 31, 20232024($ in thousands) Consolidated $ (34,151)$ (11,225)Net loss from continuing operations Adjustments: 4,238418Interest expense (6,924)6,159Income taxes 6,1615,936Depreciation 1,5051,487Amortization (29,171)2,775EBITDA 856692Acquisition costs and other 11,389-Goodwill impairment -(67)Gain on lease modification 594204Stock-based compensation 242198Non-cash lease expense 263Retention expense 130208Restructuring and severance costs $ (15,934)$ 4,013Adjusted EBITDA (8.2) %2.3 %% of Sales Reconciliations of Non-GAAP Adjusted EBITDA