 Roadshow Presentation
Follow-on Equity Offering
September 2013
Free Writing Prospectus
Registration Statement No. 333-185064 |
| Roadshow Presentation
Follow-on Equity Offering
September 2013
Free Writing Prospectus
Registration Statement No. 333-185064 |
 Forward
– Looking Statements
2
Statements in this presentation that are not historical facts are forward-looking
statements within the meaning of Section 27A of the Securities Act of 1933, as amended,
and Section 21E of the Securities Exchange Act of 1934, as amended. Such
forward-looking statements involve risks and uncertainties that could cause actual outcomes and
results to differ materially from those described in the forward-looking statements.
We believe that the expectations represented by our forward-looking statements are
reasonable, yet there can be no assurance that such expectations will prove to be
correct. Furthermore, unless otherwise stated, the forward-looking statements contained herein are
made as of the date of the presentation, and we do not undertake any obligation to update
publicly or to revise any of the included forward-looking statements, whether as a
result of new information, future events or otherwise unless required by applicable
legislation or regulation. The forward-looking statements contained herein are expressly
qualified by this cautionary statement. Readers are cautioned that these forward-looking
statements involve certain risks and uncertainties, including those contained in
filings with the U.S. Securities and Exchange Commission.
Information regarding market and industry statistics contained in this presentation is based
on information available to us that we believe is accurate. It is generally based on
management estimates and publications that are not produced for investment or economic
analysis.
We have filed a registration statement with the Securities and Exchange Commission for the
offering to which this communication relates. Before you invest, you should read the
prospectus and the prospectus supplement in that registration statement and other
documents we have filed with the Securities and Exchange Commission for more complete
information about us and this offering. The risks and uncertainties described under the caption “Risk Factors”
of the prospectus and the prospectus supplement included in the registration statement should
be considered in evaluating the forward-looking statements. You may obtain these
documents, and the documents incorporated by reference therein for free by visiting
EDGAR on the Securities and Exchange Commission’s web site at www.sec.gov.
|
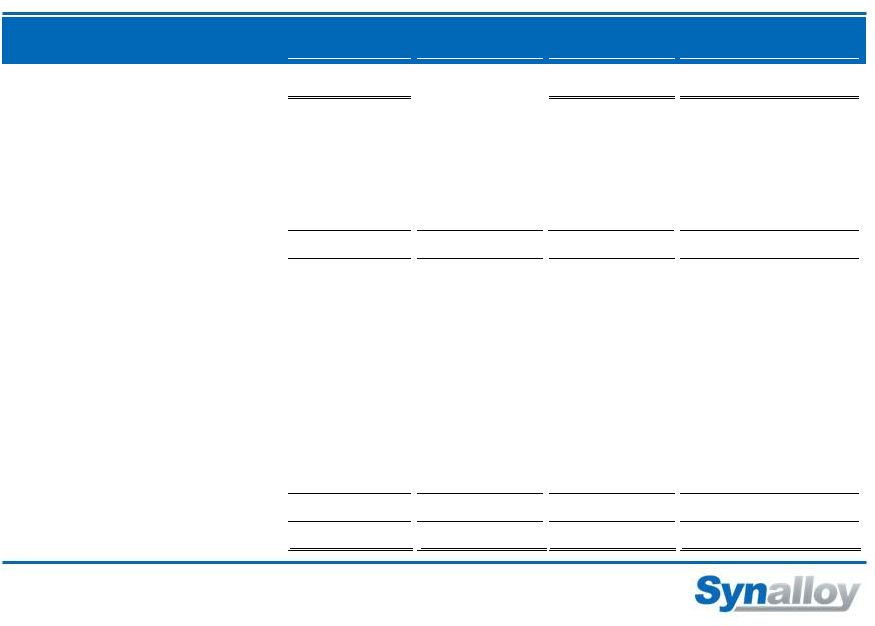
 Over-allotment Option: ..………..
Offering Summary
3
Issuer: ……………………………
Synalloy Corporation
Ticker/Exchange: ………………..
SYNL / NASDAQ
Issue: ……………………………..
Offering Size: ….…………………
Use of Proceeds: ……….………
approximately $3.5 million in new equipment
for the CRI Facility, approximately $2.0 million
in new equipment for the Company's
fabrication facilities and to pay down the
Company's line of credit
Lock-Up Provision: ………………
90 days
Expected Pricing: ………………..
Week of September 23, 2013
Bookrunners: ……………………..
Sterne Agee and BB&T Capital Markets
To fund growth initiatives including
15%, all primary
1,500,000 shares of common stock, all primary
Common Stock Follow-on |
 Today’s Presenters
4
President
and
CEO
since
January
2011
and
Director
of
the
Company
since
2004
Previously
Managing
Director
of
Avitas
Capital,
LLC
–
Investment
Banking
and
Private
Equity
Previously
Founder,
President
and
CEO,
BIZPORT,
Ltd.
–
Document
Management
Company
30 years experience in business management, financial operations, logistics, and
management consulting
MBA in Finance from Virginia Commonwealth University
CFO and Vice President of Finance since June 2010
Previously served as Assistant Vice President of Finance of Synalloy
Previously Divisional Vice President of Finance, Buffets, Inc.; Vice President of
Accounting and Corporate Controller at Ryan’s Restaurant Group, Inc.;
Senior Audit Team Member at PriceWaterhouse LLP
B.S. from Indiana University at South Bend; currently holds CPA
Craig C. Bram –
President & CEO
Richard D. Sieradzki –
CFO & Vice President of Finance |
 Investment Highlights
5
Fabrication business in the early stages of a major turnaround with backlog up
225% since the beginning of 2013
Poised
for
improved
pipe
manufacturing
pricing
and
profitability
following
a
favorable
anti-dumping ruling
Recently
acquired
production
capacity
in
the
Specialty
Chemicals
segment
New
Metals
segment
manufacturing
initiatives
providing
increased
throughput
and
efficiencies
Proven
M&A Capability
Disciplined
M&A
Strategy
–
experienced
at
the
Management
and
Board
levels
Palmer of Texas acquired in August 2012 at approximately 5.5X trailing EBITDA,
performing in line with expectations and contributing to increasing
margins CRI acquired in August 2013, adding much needed capacity at a
significant discount to replacement value and accretive in first year
Advantageous
Macro Environment
Shale “revolution”
resulting in low natural gas prices and setting the stage for increased
infrastructure spending for the foreseeable future
Already serving the growing domestic energy market, and focused on additional
opportunities
Repositioned
for Growth
Recent expansion of sales and marketing has lead to successful penetration of new
end markets with strong growth characteristics
The shift in sales has not only provided the foundation for strong revenue growth,
it will generate the opportunity to fuel margin expansion
Growing list of blue chip customers across both segments
Conditions
Ripe to Excel |
 Synalloy
Overview 6
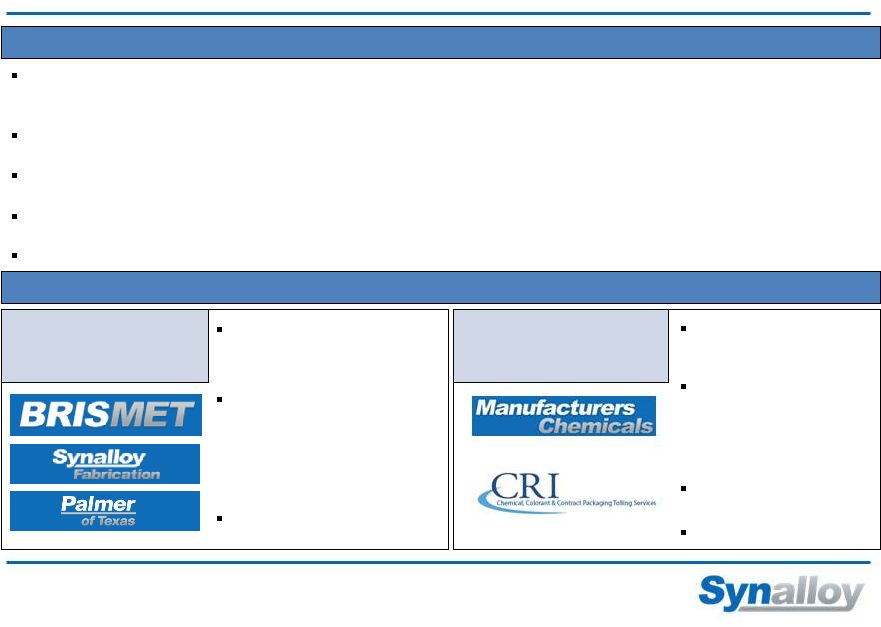
Company Overview
Synalloy
Metals
Comprised of BRISMET,
Synalloy Fabrication and
Palmer
Targets customers requiring
materials which are:
3 Facilities totaling 520k sq. ft
Comprised of
Manufacturers Chemicals
and CRI Tolling
Produces specialty
chemicals for a diverse
set of industries
Longstanding blue chip
customer base
Stable, attractive margins
(1)
LTM as of June 29, 2013.
(2)
Adjusted for non-cash items and for inventory gains/losses attributable to
movement in nickel prices; Adjusted EBITDA is a non-GAAP metric
– see Appendix for reconciliation tables.
Synalloy
Chemicals
Diversified industrial manufacturer of metal and specialty chemical products sold
into a wide range of end markets
Revenues
(1)
: $217.5MM
Adjusted EBITDA
(1)(2)
: $17.9MM
Approximately 600 employees
Founded in 1945 and headquartered in Spartanburg, SC
Business Segments
•
Corrosion-resistant
•
Suitable for high-purity
processes
•
Over 1,100 specialty
formulations |
 Our
Products and Services 7
Stainless
Steel Pipes
Titanium
Pipes
Super Duplex
Pipes
Nickel Alloy
Pipes
Bending
X-Ray
Heat
Treating
Freight/
Logistics
Fiberglass
Tanks
Steel Tanks
Field Erected
Tanks
Tank
Accessories
Sulfated
Derivatives
Additives
Lubricants
Defoamers
Dry Blending
High Viscosity
Liquid Mixing
Dispersions |
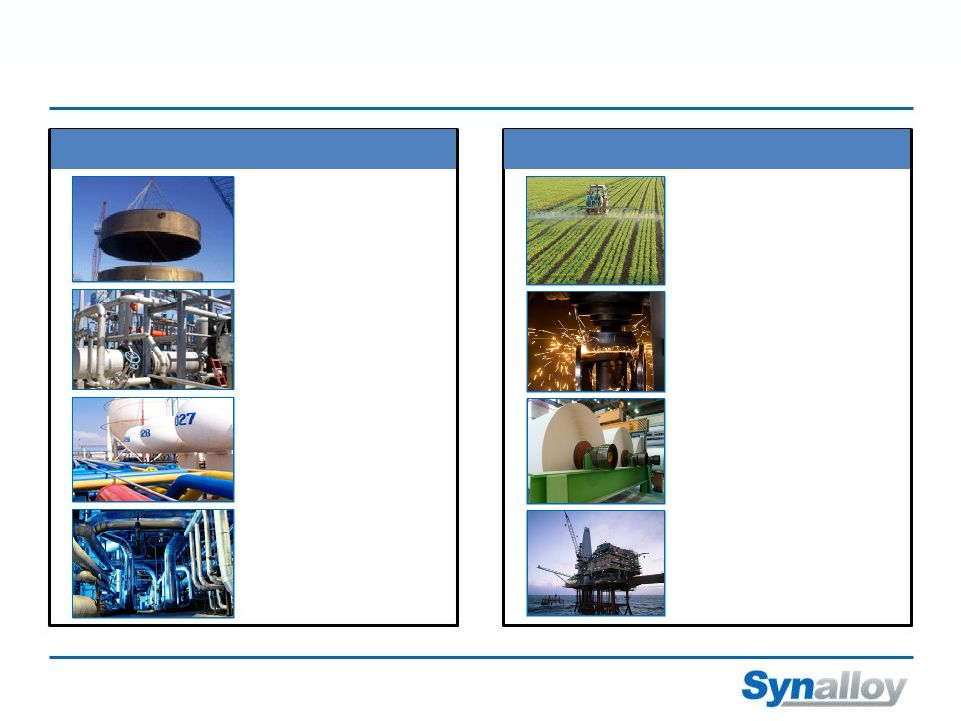 Oil
and Gas Select End Markets Served
8
Metals Segment
Power
Chemicals
Water/Waste Water
Specialty Chemicals Segment
Agricultural
Metal Working
Paper
Petroleum & Mining |
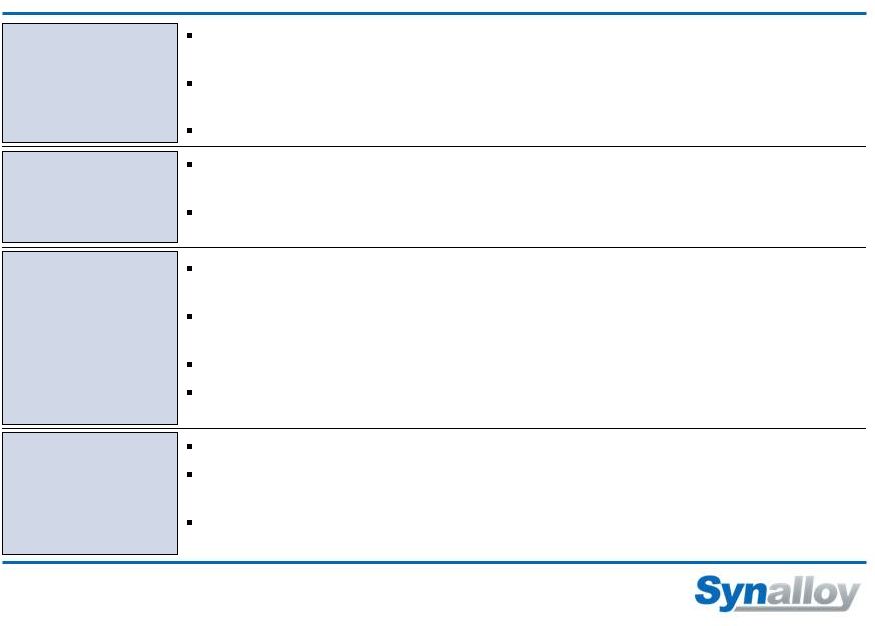
 Experienced Management Team
9
Title
Years of Experience
Craig Bram
President and CEO
30+
Richard Sieradzki
CFO and Vice President of Finance
35+
Kyle Pennington
President –
Synalloy Metals
25+
John Tidlow
Executive
Vice
President
–
Synalloy
Fabrication
25+
Kevin Hrebenar
Executive
Vice
President
of
Operations
–
Synalloy
Chemicals
25+
Greg Gibson
20+
Executive Vice President of Sales – Synalloy Chemicals |
 |
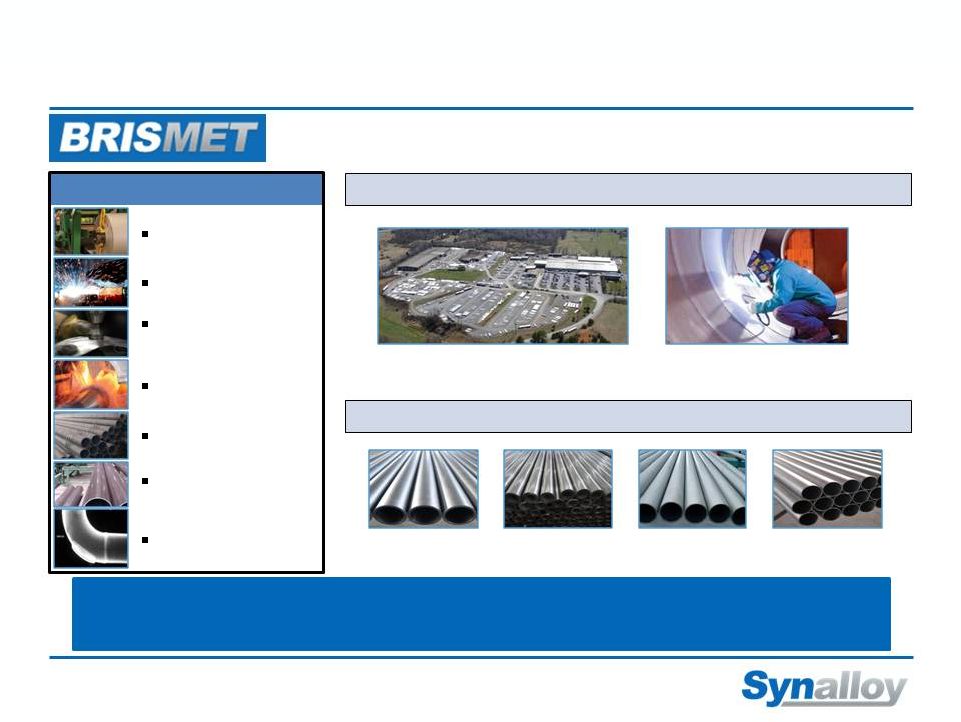 BRISMET –
Overview
11
North American leader in welded stainless steel
and special alloy pipe production
Operates a 190,000 square-
foot facility in Bristol, TN
Produces welded pipe
sizes from ½”
to 120”
Capabilities
Forming
X-Ray / Testing
End Preparation
Surface Finishing
Heat Treatment
Welding
Cold Working /
Plannishing
Diverse equipment capabilities to provide large and small diameter pipe in a
wide range of schedules/wall thicknesses, gauges and long lengths
Stainless
Steel Pipes
Titanium
Pipes
Super Duplex
Pipes
Nickel Alloy
Pipes
Product Overview
Business Overview |
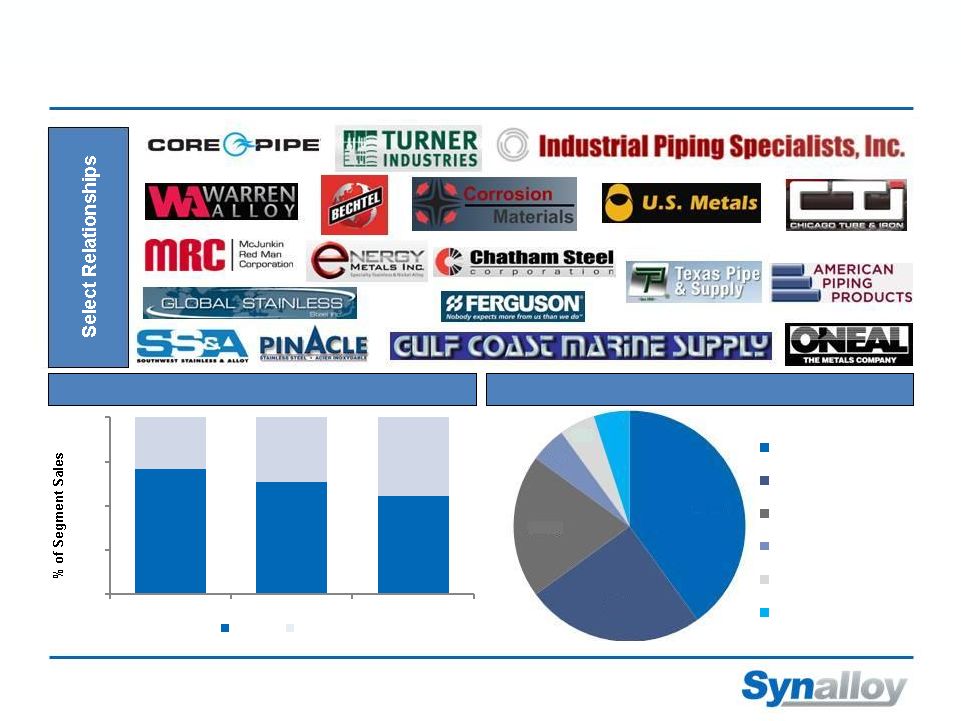 BRISMET –
Key Relationships
12
Customer Breakdown
End Markets
40%
25%
20%
5%
5%
5%
Oil & Gas
Power/Energy
Chemical
Pulp & Paper
Mining
Water/Waste Water
71%
63%
55%
29%
37%
45%
0%
25%
50%
75%
100%
2010
2011
2012
Top 10
Other |
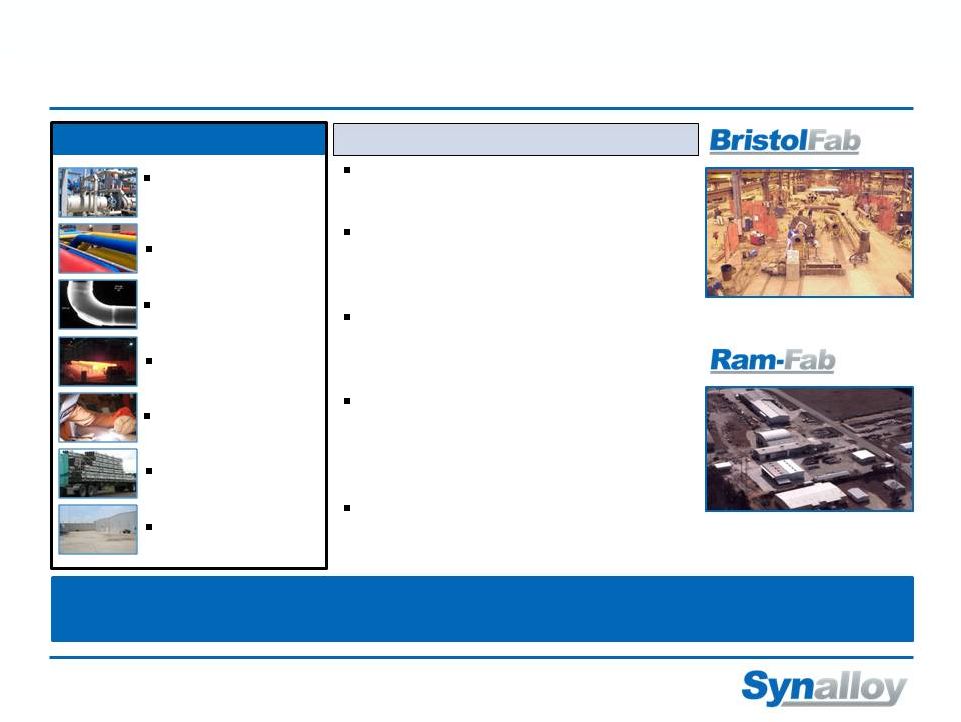 Synalloy Fabrication –
Overview
13
Comprised of BristolFab and, its sister
company, Ram-Fab LLC
Provides complete turn-key pipe
fabrication solutions across a wide
variety of market segments
Fabrication
capabilities
from
1/2”
to
144”
(12.7 millimeters to 4 meters) in
diameter
Combined union and non-union
fabrication capabilities allow for
comprehensive fabrication offerings for
both domestic and international projects
Services include: Modular Construction,
OEM Services, and Commercial
Bonding
Business Description
Industry leader in high nickel alloy, stainless steel, carbon and chrome
pipe fabrication for over 40 years
Bristol, Tennessee
Crossett, Arkansas
Capabilities
Cutting / Forming /
Bending
Warehousing
Freight Logistics
Surface Finishing
Heat Treatment
Painting
X-Ray |
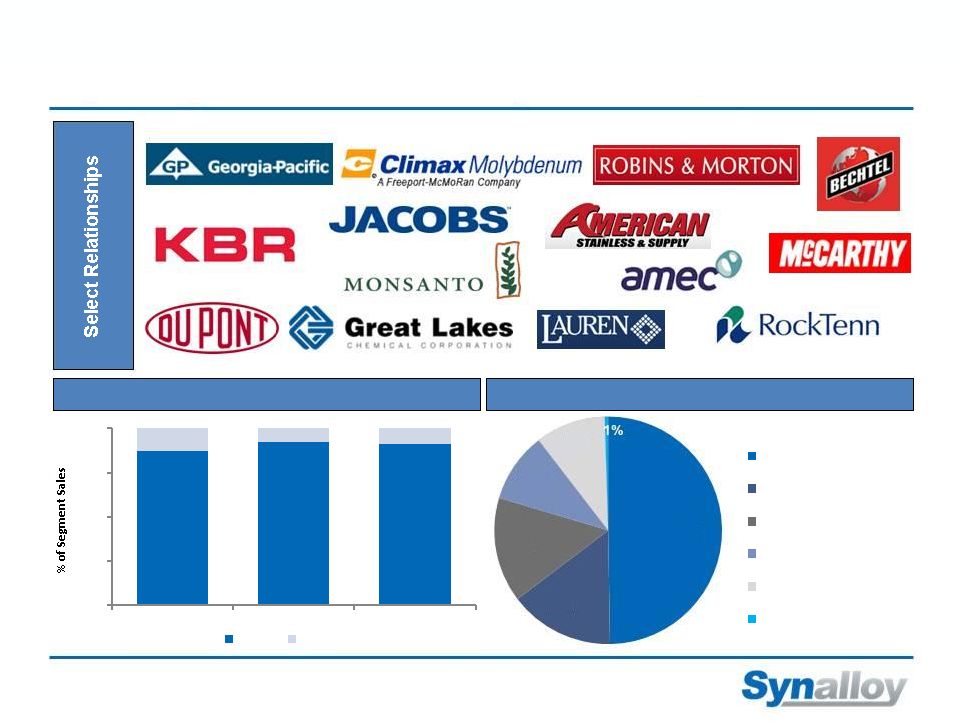 Synalloy Fabrication –
Key Relationships
14
End Markets
Customer Breakdown
50%
15%
15%
10%
10%
Chemicals
Water & Waste Water
Oil & Gas
Mining
Power & Energy
Pulp & Paper
87%
92%
91%
13%
8%
9%
0%
25%
50%
75%
100%
2010
2011
2012
Top 10
Other |
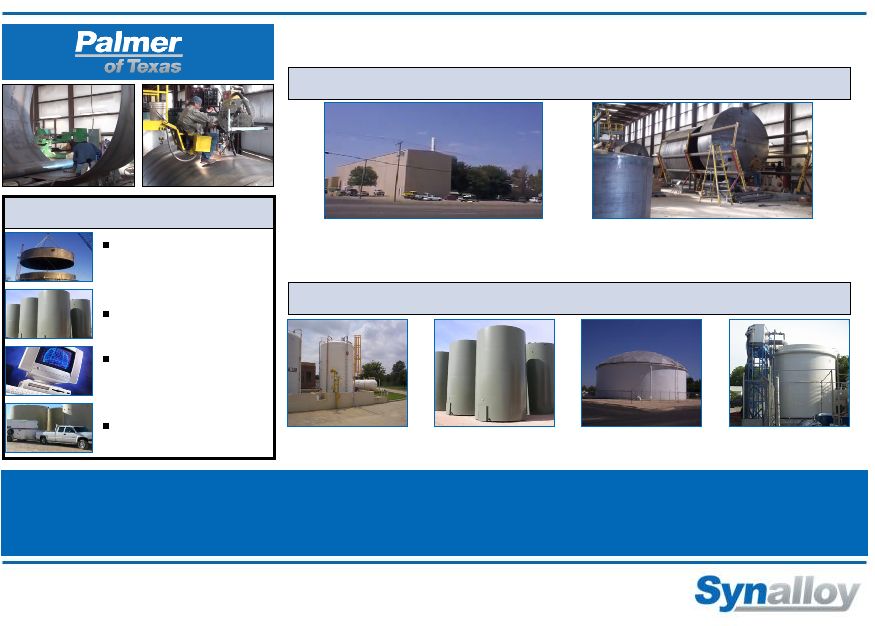 Palmer
of Texas – Overview
15
Fiberglass
Tanks
Steel Tanks
Field Erected
Tanks
Tank
Accessories
Strategically located in the heart of the Permian Basin in West Texas with
direct access to emerging shale oil plays, Palmer is able to provide
customers with the majority of their tank battery
Capabilities
On-site Delivery /
Setup
Drafting /
Engineering
Field Services
Painting / Coating
Operates a 125,000 square-
foot facility situated on 20
acres in Andrews, TX
Produces fiberglass and
steel tanks for 50 to 1,000
barrels of volume
Product Overview
Business Overview
Industry leader in manufacturing fiberglass and steel liquid
storage tanks and separation equipment |
 Palmer
of Texas – Permian Focused
16
Key Relationships
Increasing End Market Demand
The Permian Basin accounts for two-thirds of oil production in Texas and
approximately 15% of the entire United States
2012 Permian Basin production was 1.25 million bbl/d and is expected to grow to
1.85 million
bbl/d
by
2015
and
to
3.5
million
bbl/d
by
2025
(1)
Over
492
rigs
(~25%
of
US
total)
are
operating
in
the
Permian
Basin
(1)
(1)
U.S. Energy Information Administration 2013 Short-Term Energy Outlook
Report. |
 Synalloy Metals –
Drivers of Growth
Automated steel tank line will be fully operational by the end of 2013, increasing
production by approximately 30%
17
Palmer’s Steel
Production Capacity
Ramping Up
Oil & Gas Demand in
Palmer’s Immediate
Area
Receipt of Pressure
Vessel Certification
Will open up numerous additional clients who want to purchase tanks and pressure
vessels from a single vendor
Horizontal
drilling
technology
and
higher
oil
prices
are
driving
a
shale
oil
drilling
boom
in
the Permian Basin and Eagle Ford Shale, increasing the need for tanks
Anti-Dumping Ruling
Potential
Nickel Price
Appreciation
Nickel prices are currently at 2009 recessionary levels, where 30% of the
world’s production is unprofitable, indicating potential for price
increases Improving prices and margins following the soon to be implemented
duty increases on imported pipe from Asian countries
Strong
Backlog
Improving Conversion
Margins
Conversion margins on current backlog have improved substantially over prior
years Current
backlog
is
at
a
historical
high
-
$63
million
Favorable Natural Gas
Price Environment
Early stages of increased infrastructure spending due to lower natural gas prices
from the shale “revolution” |
 |
 Synalloy Chemicals –
Overview
19
One of the largest custom chemical formulators in the U.S. with attractive,
stable margins and longstanding customer relationships
Select Products & Services
Combines state of the art equipment and the most advanced
technology to provide a wide variety of specialty chemicals for
customers across over 20 industries
Full service Chemical Manufacturer with high-
temperature reaction vessels, extensive
blending and mixing vessels, powder blending
capabilities and a variety of methods for
particle size reduction
Business Overview
Manufacturers Chemicals
CRI Tolling
High quality toll manufacturer that provides
outside manufacturing resources including high
viscosity mixing, liquid mixing, dispersions, wet
milling, filtration & purification, liquid mixing,
dispersions, and dry bulk bagging
Dispersions
Additives
Lubricants
Liquid Mixing
125,000 sq. ft. facility
–
Cleveland, TN
135,000 sq. ft. facility
–
Fountain Inn, SC |
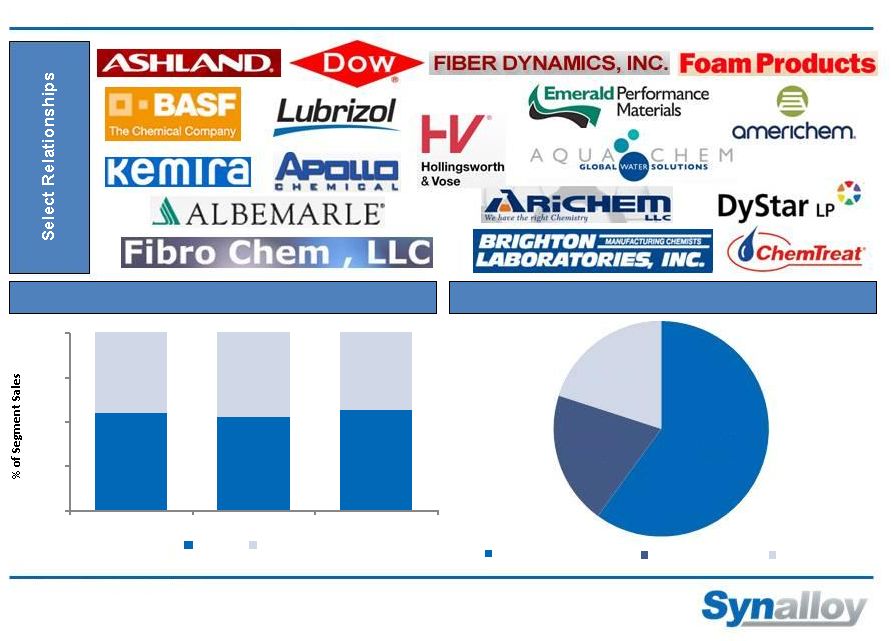 Key
Relationships 20
Contract
vs.
Non-Contract
Sales
(1)
(1)
Data as of December 31, 2012.
60%
20%
20%
Contract Manufacturing
Intermediate Sales
Direct Sales
Manufacturers Chemicals Customer Breakout
55%
53%
56%
45%
47%
44%
0%
25%
50%
75%
100%
2010
2011
2012
Top 10
Other |
 Drivers of Growth
21
Represents a small percentage of total sales for the Specialty
Chemicals group, with opportunities to penetrate the market with
existing product lines
Agriculture
Mining
Heavy users of defoamers and dust inhibitors with excellent
potential to grow sales of existing products
Existing
Customers
Sale of existing products to CRI customers
Commercialization of late-stage development phase products at CRI
Oil & Gas
Substantially larger volume requirements than current customers of
the Specialty Chemicals group with higher gross margins
Product
Development |
 Financial
Overview |
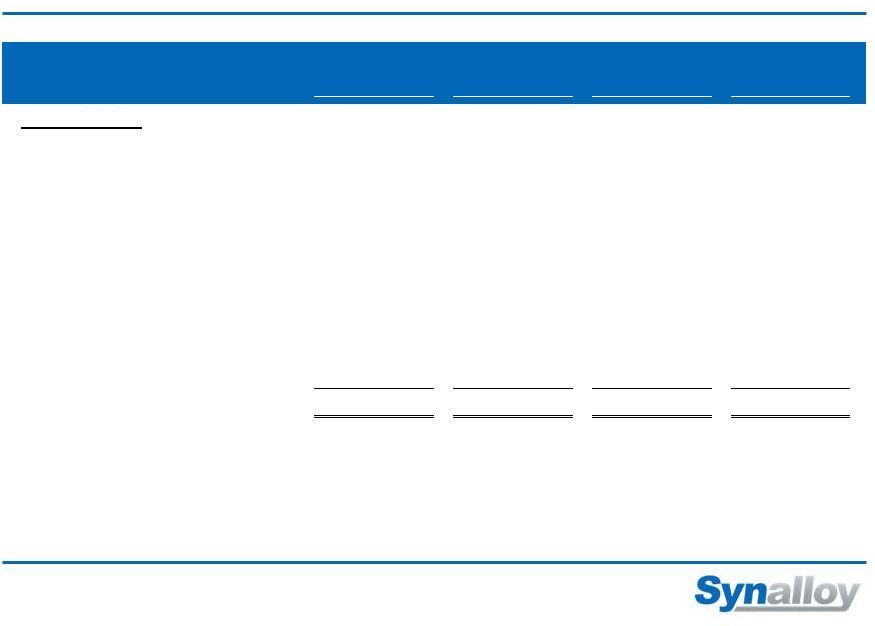
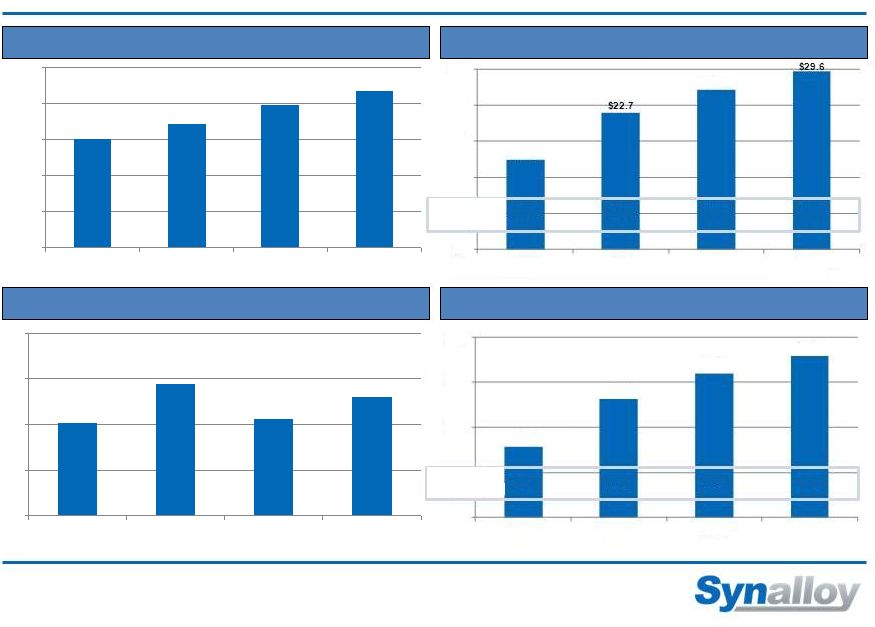 Consolidated Historical Financial Performance
23
$151.1
$170.6
$197.7
$217.5
$0
$50
$100
$150
$200
$250
2010
2011
2012
LTM
6/29/2013
Revenue
Gross
Profit
(1)
Net Income
Adjusted
EBITDA
(1)
$4.0
$5.8
$4.2
$5.2
$0
$2
$4
$6
$8
2010
2011
2012
LTM
6/29/2013
Note: Dollars in millions.
(1)
Adjusted for non-cash items and for inventory gains/losses attributable to
movement
in
nickel
prices;
Adjusted
EBITDA
is
a
non-GAAP
metric
–
see
Appendix
for
reconciliation
tables.
5.2%
7.7%
8.1%
8.2%
Adj. EBITDA
Margin
9.8%
13.3%
13.4%
13.6%
Gross Profit
Margin
$14.9
$26.6
$0
$12
$18
$24
$30
2010
2011
2012
LTM
6/29/2013
$7.8
$13.1
$16.0
$17.9
$0
$10
$15
$20
2010
2011
2012
LTM
6/29/2013 |
 Summary
Balance Sheet 24
($ in 000s)
6/29/2013
12/31/2012
Cash
$143
$1,085
Current Assets
102,719
89,837
Long-term Assets
58,272
57,585
Total Assets
$161,134
$148,507
Current Liabilities
$29,620
$24,553
Other Liabilities
55,996
52,180
Total Liabilities
85,616
76,733
Shareholders' Equity
75,519
71,774
Total Liabilities and Shareholders' Equity
$161,134
$148,507 |
 Pro
Forma Capitalization 25
(1)
Assumes the issuance of 1,500,000 shares of common stock at recent price of $16.02
per share, the receipt of $22.4MM of net proceeds, and the use of $3.5
million to purchase new equipment for the CRI Facility, $2.0 million to
purchase new equipment for the our fabrication facilities, and remaining
amounts to pay down our line of credit. June 29, 2013
Adjustments for
As Adjusted for
As Adjusted for CRI
($ in 000s)
Actual
CRI Acquisition
CRI Acquisition
Acquisition and Offering
(1)
Cash and cash equivalents
$143
--
$143
$143
Long term debt, including current portion:
Line of credit
$23,399
$869
$24,268
$7,335
Term loan
20,625
--
20,625
20,625
Mortgage and equipment loan
--
4,033
4,033
4,033
Total long term debt
44,024
4,902
48,926
31,993
Shareholder's Equity:
Common stock, $1.00 par value;
12,000,000 shares authorized; 8,000,000
shares issued and 6,382,800 shares
outstanding (actual) and 9,500,000 shares
issued and 7,882,800 shares outstanding
(as adjusted)
8,000
--
8,000
9,500
Capital in excess of par value
1,545
--
1,545
22,478
Retained earnings
80,215
--
80,215
80,215
Cost of common stock in treasury
(1,617,200 shares)
(14,241)
--
(14,241)
(14,241)
Total Shareholder's Equity
75,519
--
75,519
97,952
Total Capitalization
$119,543
$4,902
$124,445
$129,945 |
 Investment Highlights
26
Fabrication business in the early stages of a major turnaround with backlog up
225% since the beginning of 2013
Poised
for
improved
pipe
manufacturing
pricing
and
profitability
following
a
favorable
anti-dumping ruling
Recently
acquired
production
capacity
in
the
Specialty
Chemicals
segment
New
Metals
segment
manufacturing
initiatives
providing
increased
throughput
and
efficiencies
Proven
M&A Capability
Disciplined M&A Strategy –
experienced at the Management and Board levels
Palmer of Texas acquired in August 2012 at approximately 5.5X trailing EBITDA,
performing in line with expectations and contributing to increasing
margins CRI acquired in August 2013, adding much needed capacity at a
significant discount to replacement value and accretive in first year
Advantageous
Macro Environment
Shale “revolution”
resulting in low natural gas prices and setting the stage for increased
infrastructure spending for the foreseeable future
Already serving the growing domestic energy market, and focused on additional
opportunities
Repositioned
for Growth
Recent expansion of sales and marketing has lead to successful penetration of new
end markets with strong growth characteristics
The shift in sales has not only provided the foundation for strong revenue growth,
it will generate the opportunity to fuel margin expansion
Growing list of blue chip customers across both segments
Conditions
Ripe to Excel |
 Appendix |
 Adjusted EBITDA Reconciliation
28
Consolidated
Net Income
$4.0
$5.8
$4.2
$5.2
Adjustments:
Interest Expense
0.1
0.1
0.6
1.2
Change in Fair Value
of Interest Rate Swap
-
-
0.1
(0.5)
Tax Provision
2.1
3.0
2.1
2.6
Depreciation
2.6
2.6
2.9
3.2
Amortization
-
-
0.6
1.3
Inventory Loss (Gain)
(1.0)
1.6
4.6
4.0
Acquisition Costs
-
-
0.9
0.9
Adjusted EBITDA
$7.8
$13.1
$16.0
$17.9
LTM
2010
2011
2012
6/29/2013 |
 Adjusted EBITDA Reconciliation
29
Metals Segment
Net Income
$3.7
$9.3
$6.1
$7.0
Adjustments:
Interest Expense
-
-
-
-
Change in Fair Value
of Interest Rate Swap
-
-
-
-
Tax Provision
-
-
-
-
Depreciation
2.1
2.1
2.2
2.5
Amortization
-
-
0.6
1.3
Inventory Loss (Gain)
(1.0)
1.6
4.6
4.0
Acquisition Costs
-
-
-
-
Adjusted EBITDA
$4.8
$13.0
$13.5
$14.8
LTM
2010
2011
2012
6/29/2013 |
 Adjusted EBITDA Reconciliation
30
Chemicals Segment
Net Income
$4.0
$2.2
$4.8
$5.5
Adjustments:
Interest Expense
-
-
-
-
Change in Fair Value
of Interest Rate Swap
-
-
-
-
Tax Provision
-
-
-
-
Depreciation
0.4
0.4
0.5
0.5
Amortization
-
-
-
-
Inventory Loss (Gain)
-
-
-
-
Acquisition Costs
-
-
-
-
Adjusted EBITDA
$4.4
$2.6
$5.3
$6.0
LTM
2010
2011
2012
6/29/2013 |
 Adjusted EBITDA Reconciliation
31
Unallocated Corporate
Net Income
($3.7)
($5.7)
($6.7)
($7.3)
Adjustments:
Interest Expense
0.1
0.1
0.6
1.2
Change in Fair Value
of Interest Rate Swap
-
-
0.1
(0.5)
Tax Provision
2.1
3.0
2.1
2.6
Depreciation
0.1
0.1
0.2
0.2
Amortization
-
-
-
-
Inventory Loss (Gain)
-
-
-
-
Acquisition Costs
-
-
0.9
0.9
Adjusted EBITDA
($1.4)
($2.5)
($2.8)
($2.9)
LTM
2010
2011
2012
6/29/2013 |